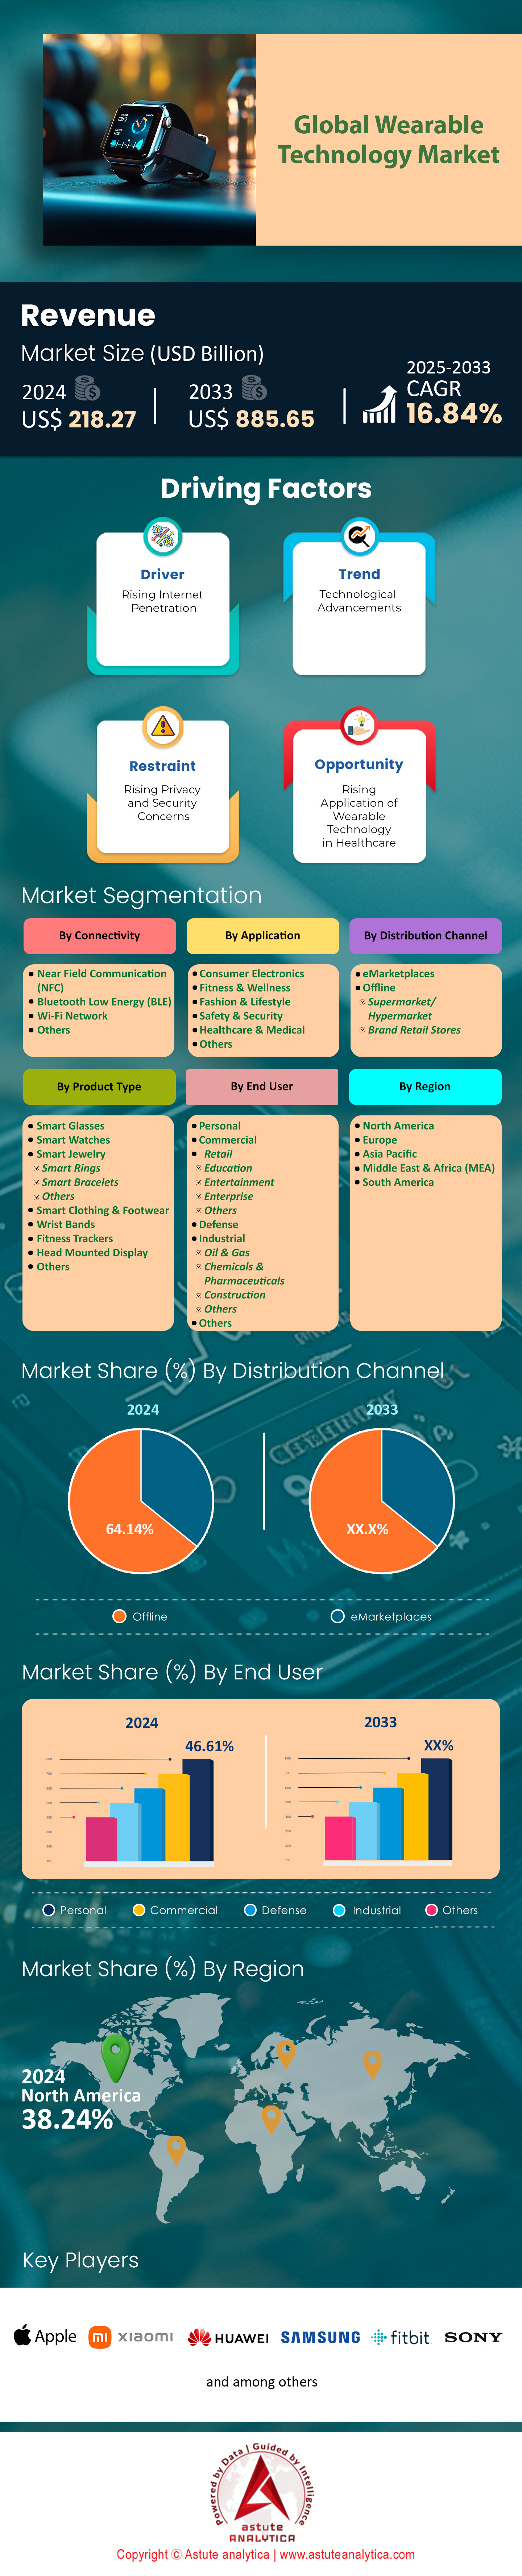
Wearable Technology Market: By Product Type (Smart Glasses, Smart Watches, Smart Jewelry (Smart Rings, Smart Bracelets, Others), Smart Clothing & Footwear, Wrist Bands, Fitness Trackers, Head Mounted Display, Others); Connectivity (Near Field Communication (NFC), Bluetooth Low Energy (BLE), Wi-Fi Network, Others); Application (Consumer Electronics, Fitness & Wellness, Fashion & Lifestyle, Safety & Security, Healthcare & Medical, Others); End Users (Personal, Commercial (Retail, Education, Entertainment, Enterprise, Others), Defense, Industrial (Oil & Gas, Chemicals & Pharmaceuticals, Construction, Others), Others); Distribution Channel (eMarketplaces, Offline (Supermarket/ Hypermarket, Brand Retail Stores); Region—Market Size, Industry Dynamics, Opportunity Analysis and Forecast for 2025–2033
- Last Updated: Mar-2025 | Format:
![pdf]()
![powerpoint]()
![excel]() | Report ID: AA01251094 | Delivery: Immediate Access
| Report ID: AA01251094 | Delivery: Immediate Access


 | Report ID: AA01251094 | Delivery: Immediate Access
 Table: 1 Industry Outlook : Energy Sources For Wearable Sensing Devices
Table: 2 Industry Outlook : Sensor Technologies For Wearable Sensing Devices
Table: 3 Pestle Impact Analysis : Political Factors
Table: 4 Pestle Impact Analysis : Economic Factors
Table: 5 Pestle Impact Analysis : Social Factors
Table: 6 Pestle Impact Analysis : Technological Factors
Table: 7 Pestle Impact Analysis : Legal Factors
Table: 8 Pestle Impact Analysis : Environmental Factors
Table: 9 Driver : Estimated Global Prevalence And Numbers Of Adults Living With Obesity In 2010–2033
Table: 10 Market Dynamics And Trends: Impact Analysis of Market Dynamics
Table: 11 Product Price Analysis : Product Type-Based Price Analysis
Table: 12 Competitive Dashboard : Competitor Mapping & Benchmarking
Table: 13 Global Wearable Technology Market Size (US$ Bn), By Product Type, 2020-2033
Table: 14 Global Wearable Technology Market Size (US$ Bn), By Product Type, 2020-2033
Table: 15 Global Wearable Technology Market Size (US$ Bn), By Connectivity, 2020-2033
Table: 16 Global Wearable Technology Market Size (Mn Units), By Connectivity, 2020-2033
Table: 17 Global Wearable Technology Market Size (US$ Bn), By Application, 2020-2033
Table: 18 Global Wearable Technology Market Size (Mn Units), By Application, 2020-2033
Table: 19 Global Wearable Technology Market Size (US$ Bn), By End User, 2020-2033
Table: 20 Global Wearable Technology Market Size (Mn Units), By End User, 2020-2033
Table: 21 Global Wearable Technology Market Size (US$ Bn), By Distribution Channel, 2020-2033
Table: 22 Global Wearable Technology Market Size (Mn Units), By Distribution Channel, 2020-2033
Table: 23 Global Wearable Technology Market Size (US$ Bn), By Region, 2020-2033
Table: 24 Global Wearable Technology Market Size (Mn Units), By Region, 2020-2033
Table: 25 North America Wearable Technology Market Size (US$ Bn), By Country, 2020-2033
Table: 26 North America Wearable Technology Market Size (Mn Units), By Country, 2020-2033
Table: 27 North America Wearable Technology Market Size (US$ Bn), By Product Type, 2020-2033
Table: 28 North America Wearable Technology Market Size (Mn Units), By Product Type, 2020-2033
Table: 29 North America Wearable Technology Market Size (US$ Bn), By Connectivity, 2020-2033
Table: 30 North America Wearable Technology Market Size (Mn Units), By Connectivity, 2020-2033
Table: 31 North America Wearable Technology Market Size (US$ Bn), By Application, 2020-2033
Table: 32 North America Wearable Technology Market Size (Mn Units), By Application, 2020-2033
Table: 33 North America Wearable Technology Market Size (US$ Bn), By End User, 2020-2033
Table: 34 North America Wearable Technology Market Size (Mn Units), By End User, 2020-2033
Table: 35 North America Wearable Technology Market Size (US$ Bn), By Distribution Channel, 2020-2033
Table: 36 North America Wearable Technology Market Size (Mn Units), By Distribution Channel, 2020-2033
Table: 37 Europe Wearable Technology Market Size (US$ Bn), By Country, 2020-2033
Table: 38 Europe Wearable Technology Market Size (Mn Units), By Country, 2020-2033
Table: 39 Europe Wearable Technology Market Size (US$ Bn), By Product Type, 2020-2033
Table: 40 Europe Wearable Technology Market Size (Mn Units), By Product Type, 2020-2033
Table: 41 Europe Wearable Technology Market Size (US$ Bn), By Connectivity, 2020-2033
Table: 42 Europe Wearable Technology Market Size (Mn Units), By Connectivity, 2020-2033
Table: 43 Europe Wearable Technology Market Size (US$ Bn), By Application, 2020-2033
Table: 44 Europe Wearable Technology Market Size (Mn Units), By Application, 2020-2033
Table: 45 Europe Wearable Technology Market Size (US$ Bn), By End User, 2020-2033
Table: 46 Europe Wearable Technology Market Size (Mn Units), By End User, 2020-2033
Table: 47 Europe Wearable Technology Market Size (US$ Bn), By Distribution Channel, 2020-2033
Table: 48 Europe Wearable Technology Market Size (Mn Units), By Distribution Channel, 2020-2033
Table: 49 Asia Pacific Wearable Technology Market Size (US$ Bn), By Country, 2020-2033
Table: 50 Asia Pacific Wearable Technology Market Size (Mn Units), By Country, 2020-2033
Table: 51 Asia Pacific Wearable Technology Market Size (US$ Bn), By Product Type, 2020-2033
Table: 52 Asia Pacific Wearable Technology Market Size (Mn Units), By Product Type, 2020-2033
Table: 53 Asia Pacific Wearable Technology Market Size (US$ Bn), By Connectivity, 2020-2033
Table: 54 Asia Pacific Wearable Technology Market Size (Mn Units), By Connectivity, 2020-2033
Table: 55 Asia Pacific Wearable Technology Market Size (US$ Bn), By Application, 2020-2033
Table: 56 Asia Pacific Wearable Technology Market Size (Mn Units), By Application, 2020-2033
Table: 57 Asia Pacific Wearable Technology Market Size (US$ Bn), By End User, 2020-2033
Table: 58 Asia Pacific Wearable Technology Market Size (Mn Units), By End User, 2020-2033
Table: 59 Asia Pacific Wearable Technology Market Size (US$ Bn), By Distribution Channel, 2020-2033
Table: 60 Asia Pacific Wearable Technology Market Size (Mn Units), By Distribution Channel, 2020-2033
Table: 61 Middle East and Africa Wearable Technology Market Size (US$ Bn), By Country, 2020-2033
Table: 62 Middle East and Africa Wearable Technology Market Size (Mn Units), By Country, 2020-2033
Table: 63 Middle East and Africa Wearable Technology Market Size (US$ Bn), By Product Type, 2020-2033
Table: 64 Middle East and Africa Wearable Technology Market Size (Mn Units), By Product Type, 2020-2033
Table: 65 Middle East and Africa Wearable Technology Market Size (US$ Bn), By Connectivity, 2020-2033
Table: 66 Middle East and Africa Wearable Technology Market Size (Mn Units), By Connectivity, 2020-2033
Table: 67 Middle East and Africa Wearable Technology Market Size (US$ Bn), By Application, 2020-2033
Table: 68 Middle East and Africa Wearable Technology Market Size (Mn Units), By Application, 2020-2033
Table: 69 Middle East and Africa Wearable Technology Market Size (US$ Bn), By End User, 2020-2033
Table: 70 Middle East and Africa Wearable Technology Market Size (Mn Units), By End User, 2020-2033
Table: 71 Middle East and Africa Wearable Technology Market Size (US$ Bn), By Distribution Channel, 2020-2033
Table: 72 Middle East and Africa Wearable Technology Market Size (Mn Units), By Distribution Channel, 2020-2033
Table: 73 South America Wearable Technology Market Size (US$ Bn), By Country, 2020-2033
Table: 74 South America Wearable Technology Market Size (Mn Units), By Country, 2020-2033
Table: 75 South America Wearable Technology Market Size (US$ Bn), By Product Type, 2020-2033
Table: 76 South America Wearable Technology Market Size (Mn Units), By Product Type, 2020-2033
Table: 77 South America Wearable Technology Market Size (US$ Bn), By Connectivity, 2020-2033
Table: 78 South America Wearable Technology Market Size (Mn Units), By Connectivity, 2020-2033
Table: 79 South America Wearable Technology Market Size (US$ Bn), By Application, 2020-2033
Table: 80 South America Wearable Technology Market Size (Mn Units), By Application, 2020-2033
Table: 81 South America Wearable Technology Market Size (US$ Bn), By End User, 2020-2033
Table: 82 South America Wearable Technology Market Size (Mn Units), By End User, 2020-2033
Table: 83 South America Wearable Technology Market Size (US$ Bn), By Distribution Channel, 2020-2033
Table: 84 South America Wearable Technology Market Size (Mn Units), By Distribution Channel, 2020-2033
Table: 85 Adidas Ag : Product
Table: 86 Adidas Ag: Financial Analysis
Table: 87 Apple Inc. : Recent Developments
Table: 88 Apple Inc. : Product
Table: 89 Apple Inc.: Financial Analysis
Table: 90 Fitbit Inc. : Recent Developments
Table: 91 Fitbit Inc. : Products
Table: 92 Google LLC (Alphabet Inc.): Financial Analysis
Table: 93 Fossilgroup, Inc. : Recent Developments
Table: 94 Fossilgroup, Inc. : Product
Table: 95 Fossilgroup, Inc.: Financial Analysis
Table: 96 Fujitsu Limited : Product
Table: 97 Fujitsu Limited.: Financial Analysis
Table: 98 Garmin Ltd : Recent Developments
Table: 99 Garmin Ltd : Product
Table: 100 Garmin Ltd. .: Financial Analysis
Table: 101 Huawei Technologies Co., Ltd.: Recent Developments
Table: 102 Huawei Technologies Co., Ltd. : Products
Table: 103 Huawei Technologies Co., Ltd. : Financial Analysis
Table: 104 Lg Electronics : Recent Developments
Table: 105 Lg Electronics : Products
Table: 106 Lg Electronics: Financial Analysis
Table: 107 Nike, Inc : Recent Developments
Table: 108 Nike, Inc : Products
Table: 109 Nike, Inc: Financial Analysis
Table: 110 Samsung Electronics Co. Ltd : Recent Developments
Table: 111 Samsung Electronics Co. Ltd : Products
Table: 112 Samsung Electronics Co. Ltd.. : Financial Analysis
Table: 113 Seiko Epson Corporation : Products
Table: 114 Seiko Epson Corporation.: Financial Analysis
Table: 115 Sony Corporation : Recent Developments
Table: 116 Sony Corporation : Products
Table: 117 Sony Corporation: Financial Analysis
Table: 118 Vuzix Corporation : Recent Developments
Table: 119 Vuzix Corporation : Products
Table: 120 Vuzix Corporation. : Financial Analysis
Table: 121 Xiaomi Corporation : Recent Developments
Table: 122 Xiaomi Corporation : Products
Table: 123 Xiaomi Corporation. : Financial Analysis
Table: 124 Zepp Health Corporation : Recent Developments
Table: 125 Zepp Health Corporation : Product
Table: 126 Zepp Health Corporation.: Financial Analysis
Table: 127 Other Prominent Players
Figure: 1 Executive Summary : Global Wearable Technology Market, By Value (US$ Bn), 2020-2033
Figure: 2 Executive Summary : Global Wearable Technology Market, By Volume (Bn Units), 2020-2033
Figure: 3 Executive Summary : By Product Type (Smart Watches)
Figure: 4 Executive Summary : By Connectivity (Bluetooth Low Energy)
Figure: 5 Executive Summary : By Application (Consumer Electronics)
Figure: 6 Executive Summary : By Industry (Personal)
Figure: 7 Executive Summary : By Distribution Channel (Offline)
Figure: 8 Industry Outlook : Fitness Tracker Survey
Figure: 9 Industry Outlook : Fitness Tracker Consumer Preference, By Interest
Figure: 10 Driver: Number of people using the Internet, (in Bn)
Figure: 11 Driver: Percentage of Individuals using Internet, By Region 2024
Figure: 12 Driver: Percentage of Individuals using Internet, By Income ,2024
Figure: 13 Driver: Number Of Deaths From Cardiovascular Diseases By Age, World, 2021
Figure: 14 Covid -19 Impact & Recovery : Global Wearable Technology Market, Covid-19 Impact & Recovery, By Y-O-Y (%), 2020-2033
Figure: 15 Competitive Dashboard : Market Share Analysis By Company, Based On Revenue (2024)
Figure: 16 Global Wearable Technology Market, By Product Type, CAGR (%), 2024-2033
Figure: 17 Global Wearable Technology Market Share (%), By Product Type, 2024
Figure: 18 Global Wearable Technology Market Share (%), By Product Type, 2033
Figure: 19 Global Wearable Technology Market, By Connectivity, CAGR (%), 2024-2033
Figure: 20 Global Wearable Technology Market Share (%), By Connectivity, 2024
Figure: 21 Global Wearable Technology Market Share (%), By Connectivity, 2033
Figure: 22 Global Wearable Technology Market, By Application, CAGR (%), 2024-2033
Figure: 23 Global Wearable Technology Market Share (%), By Application, 2024
Figure: 24 Global Wearable Technology Market Share (%), By Application, 2033
Figure: 25 Global Wearable Technology Market, By End User, CAGR (%), 2024-2033
Figure: 26 Global Wearable Technology Market Share (%), By End User, 2024
Figure: 27 Global Wearable Technology Market Share (%), By End User, 2033
Figure: 28 Global Wearable Technology Market, By Distribution Channel, CAGR (%), 2024-2033
Figure: 29 Global Wearable Technology Market Share (%), By Distribution Channel, 2024
Figure: 30 Global Wearable Technology Market Share (%), By Distribution Channel, 2033
Figure: 31 Global Wearable Technology Market, By Region, CAGR (%), 2024-2033
Figure: 32 Global Wearable Technology Market Share (%), By Region, 2024
Figure: 33 Global Wearable Technology Market Share (%), By Region, 2033
Figure: 34 North America: Highest Share (%) Segment
Figure: 35 North America: Net Opportunity Addition, In US$ Bn
Figure: 36 North America: Opportunity Assessment, By Product Type
Figure: 37 North America: Impact Analysis - Chart
Figure: 38 North America: Opportunity Assessment, By Connectivity
Figure: 39 North America: Opportunity Assessment, By Application
Figure: 40 North America: Opportunity Assessment, By End User
Figure: 41 North America: Opportunity Assessment, By Distribution Channel
Figure: 42 North America Wearable Technology Market Share (%), By Country, 2024
Figure: 43 North America Wearable Technology Market Share (%), By Country, 2033
Figure: 44 North America Wearable Technology Market Share (%), By Product Type, 2024
Figure: 45 North America Wearable Technology Market Share (%), By Product Type, 2033
Figure: 46 North America Wearable Technology Market Share (%), By Connectivity, 2024
Figure: 47 North America Wearable Technology Market Share (%), By Connectivity, 2033
Figure: 48 North America Wearable Technology Market Share (%), By Application, 2024
Figure: 49 North America Wearable Technology Market Share (%), By Application, 2033
Figure: 50 North America Wearable Technology Market Share (%), By End User, 2024
Figure: 51 North America Wearable Technology Market Share (%), By End User, 2033
Figure: 52 North America Wearable Technology Market Share (%), By Distribution Channel, 2024
Figure: 53 North America Wearable Technology Market Share (%), By Distribution Channel, 2033
Figure: 54 Europe: Highest Share (%) Segment
Figure: 55 Europe: Net Opportunity Addition, In US$ Bn
Figure: 56 Europe: Impact Analysis - Chart
Figure: 57 Europe: Opportunity Assessment, By Product Type
Figure: 58 Europe: Opportunity Assessment, By Connectivity
Figure: 59 Europe: Opportunity Assessment, By Application
Figure: 60 Europe: Opportunity Assessment, By End User
Figure: 61 Europe: Opportunity Assessment, By Distribution Channel
Figure: 62 Europe Wearable Technology Market Share (%), By Country, 2024
Figure: 63 Europe Wearable Technology Market Share (%), By Country, 2033
Figure: 64 Europe Wearable Technology Market Share (%), By Product Type, 2024
Figure: 65 Europe Wearable Technology Market Share (%), By Product Type, 2033
Figure: 66 Europe Wearable Technology Market Share (%), By Connectivity, 2024
Figure: 67 Europe Wearable Technology Market Share (%), By Connectivity, 2033
Figure: 68 Europe Wearable Technology Market Share (%), By Application, 2024
Figure: 69 Europe Wearable Technology Market Share (%), By Application, 2033
Figure: 70 Europe Wearable Technology Market Share (%), By End User, 2024
Figure: 71 Europe Wearable Technology Market Share (%), By End User, 2033
Figure: 72 Europe Wearable Technology Market Share (%), By Distribution Channel, 2024
Figure: 73 Europe Wearable Technology Market Share (%), By Distribution Channel, 2033
Figure: 74 Asia Pacific: Highest Share (%) Segment
Figure: 75 Asia Pacific: Net Opportunity Addition, In US$ Bn
Figure: 76 Asia Pacific: Impact Analysis - Chart
Figure: 77 Asia Pacific: Opportunity Assessment, By Product Type
Figure: 78 Asia Pacific: Opportunity Assessment, By Connectivity
Figure: 79 Asia Pacific: Opportunity Assessment, By Application
Figure: 80 Asia Pacific: Opportunity Assessment, By End User
Figure: 81 Asia Pacific: Opportunity Assessment, By Distribution Channel
Figure: 82 Asia Pacific Wearable Technology Market Share (%), By Country, 2024
Figure: 83 Asia Pacific Wearable Technology Market Share (%), By Country, 2033
Figure: 84 Asia Pacific Wearable Technology Market Share (%), By Product Type, 2024
Figure: 85 Asia Pacific Wearable Technology Market Share (%), By Product Type, 2033
Figure: 86 Asia Pacific Wearable Technology Market Share (%), By Connectivity, 2024
Figure: 87 Asia Pacific Wearable Technology Market Share (%), By Connectivity, 2033
Figure: 88 Asia Pacific Wearable Technology Market Share (%), By Application, 2024
Figure: 89 Asia Pacific Wearable Technology Market Share (%), By Application, 2033
Figure: 90 Asia Pacific Wearable Technology Market Share (%), By End User, 2024
Figure: 91 Asia Pacific Wearable Technology Market Share (%), By End User, 2033
Figure: 92 Asia Pacific Wearable Technology Market Share (%), By Distribution Channel, 2024
Figure: 93 Asia Pacific Wearable Technology Market Share (%), By Distribution Channel, 2033
Figure: 94 Middle East and Africa: Highest Share (%) Segment
Figure: 95 Middle East and Africa: Net Opportunity Addition, In US$ Bn
Figure: 96 Middle East and Africa: Impact Analysis - Chart
Figure: 97 Middle East and Africa: Opportunity Assessment, By Product Type
Figure: 98 Middle East and Africa: Opportunity Assessment, By Connectivity
Figure: 99 Middle East and Africa: Opportunity Assessment, By Application
Figure: 100 Middle East and Africa: Opportunity Assessment, By End User
Figure: 101 Middle East and Africa: Opportunity Assessment, By Distribution Channel
Figure: 102 Middle East and Africa Wearable Technology Market Share (%), By Country, 2024
Figure: 103 Middle East and Africa Wearable Technology Market Share (%), By Country, 2033
Figure: 104 Middle East and Africa Wearable Technology Market Share (%), By Product Type, 2024
Figure: 105 Middle East and Africa Wearable Technology Market Share (%), By Product Type, 2033
Figure: 106 Middle East and Africa Wearable Technology Market Share (%), By Connectivity, 2024
Figure: 107 Middle East and Africa Wearable Technology Market Share (%), By Connectivity, 2033
Figure: 108 Middle East and Africa Wearable Technology Market Share (%), By Application, 2024
Figure: 109 Middle East and Africa Wearable Technology Market Share (%), By Application, 2033
Figure: 110 Middle East and Africa Wearable Technology Market Share (%), By End User, 2024
Figure: 111 Middle East and Africa Wearable Technology Market Share (%), By End User, 2033
Figure: 112 Middle East and Africa Wearable Technology Market Share (%), By Distribution Channel, 2024
Figure: 113 Middle East and Africa Wearable Technology Market Share (%), By Distribution Channel, 2033
Figure: 114 South America: Highest Share (%) Segment
Figure: 115 South America: Net Opportunity Addition, In US$ Bn
Figure: 116 South America: Impact Analysis - Chart
Figure: 117 South America: Opportunity Assessment, By Product Type
Figure: 118 South America: Opportunity Assessment, By Connectivity
Figure: 119 South America: Opportunity Assessment, By Application
Figure: 120 South America: Opportunity Assessment, By End User
Figure: 121 South America: Opportunity Assessment, By Distribution Channel
Figure: 122 South America Wearable Technology Market Share (%), By Country, 2024
Figure: 123 South America Wearable Technology Market Share (%), By Country, 2033
Figure: 124 South America Wearable Technology Market Share (%), By Product Type, 2024
Figure: 125 South America Wearable Technology Market Share (%), By Product Type, 2033
Figure: 126 South America Wearable Technology Market Share (%), By Connectivity, 2024
Figure: 127 South America Wearable Technology Market Share (%), By Connectivity, 2033
Figure: 128 South America Wearable Technology Market Share (%), By Application, 2024
Figure: 129 South America Wearable Technology Market Share (%), By Application, 2033
Figure: 130 South America Wearable Technology Market Share (%), By End User, 2024
Figure: 131 South America Wearable Technology Market Share (%), By End User, 2033
Figure: 132 South America Wearable Technology Market Share (%), By Distribution Channel, 2024
Figure: 133 South America Wearable Technology Market Share (%), By Distribution Channel, 2033
Figure: 134 Adidas AG : Business Revenue Segmentation, 2024
Figure: 135 Adidas AG : Geographical Revenue Segmentation, 2024
Figure: 136 Apple Inc. : Product Revenue Segmentation, 2024
Figure: 137 Apple Inc. : Geographical Revenue Segmentation, 2024
Figure: 138 Fitbit Inc. : Business Revenue Segmentation, 2024
Figure: 139 Fitbit Inc. : Geographical Revenue Segmentation, 2024
Figure: 140 Fossilgroup, Inc. : Product Revenue Segmentation, 2024
Figure: 141 Fossilgroup, Inc. : Geographical Revenue Segmentation, 2024
Figure: 142 Fujitsu Limited : Business Revenue Segmentation, 2024
Figure: 143 Fujitsu Limited : Geographical Revenue Segmentation, 2024
Figure: 144 Garmin Ltd : Business Revenue Segmentation, 2024
Figure: 145 Garmin Ltd : Geographical Revenue Segmentation, 2024
Figure: 146 Huawei Technologies Co., Ltd. : Business Revenue Segmentation, 2024
Figure: 147 Huawei Technologies Co., Ltd. : Geographical Revenue Segmentation, 2024
Figure: 148 LG Electronics : Business Revenue Segmentation, 2024
Figure: 149 Nike, Inc : Business Revenue Segmentation, 2024
Figure: 150 Nike, Inc : Geographical Revenue Segmentation, 2024
Figure: 151 Samsung Electronics Co. Ltd : Business Revenue Segmentation, 2024
Figure: 152 Samsung Electronics Co. Ltd : Geographical Revenue Segmentation, 2024
Figure: 153 Seiko Epson Corporation : Business Revenue Segmentation, 2024
Figure: 154 Seiko Epson Corporation : Geographical Revenue Segmentation, 2024
Figure: 155 Sony Corporation : Business Revenue Segmentation, 2024
Figure: 156 Sony Corporation : Geographical Revenue Segmentation, 2024
Figure: 157 Vuzix Corporation : Geographical Revenue Segmentation, 2024
Figure: 158 Xiaomi Corporation : Business Revenue Segmentation, 2024
Figure: 159 Xiaomi Corporation : Geographical Revenue Segmentation, 2024
Figure: 160 Zepp Health Corporation : Business Revenue Segmentation, 2024


Choose License Type


Features | Type of License | ||||
Data Book | Single User |   Multi User | Corporate | ||
| e-Access | ✓ | ✓ | ✓ | ✓ | |
User Sharing | 1 User Only | 1 User Only | Up to 7 Users | Unlimited User Access | |
⨉ | ⨉ | ⨉ | ✓ | ||
Free Customization | No Free Customization | Up To 30 hrs work | Up To 60 hrs work | Up To 80 hrs work | |
Deliverable |
| ⨉ | ✓ | ✓ | ✓ |
| ✓ | ⨉ | ✓ | ✓ | |
| ⨉ | ⨉ | ⨉ | ✓ | |
Analyst Support | 2-Months Analyst Support | 4-Months Analyst Support | 7-Months Analyst Support | One Year Analyst Support | |
Free Report update in next update cycle | ⨉ | ⨉ | ⨉ | ✓ | |
Free Industry Update (Within 180 days) | ⨉ | ⨉ | ⨉ | ✓ | |
Benefit | Up to 10% off on Post Purchase | Up to 20% off on Post Purchase | Up to 30% off on Post Purchase | Up to 40% off on Post Purchase | |