U.S. Sulfentrazone-Based Herbicides Market: By Form (Liquid and Solid); Functionality (Pre-Emergence Herbicide and Post Emergence Herbicide); Application (Agricultural Crop (Corn, Soyabean, Tobacco, Sugarcane, Pulses, Sunflower, Peas, Cereal, Others), Turf (Seeded, Sodded, Sprigged), Ornamentals (Trees (Shrubs and Others), Fruits and Vegetables (Tomatoes, Potatoes, Others), Others); End Users (Farmers, Agricultural Producers, Turf Managers, Landscapers, Others); Distribution Channel (Online and Offline (Direct and Distributor)–Market Size, Industry Dynamics, Opportunity Analysis and Forecast for 2025–2033
- Last Updated: Mar-2025 | Format:
![pdf]()
![powerpoint]()
![excel]() | Report ID: AA03251227 | Delivery: Immediate Access
| Report ID: AA03251227 | Delivery: Immediate Access


 | Report ID: AA03251227 | Delivery: Immediate Access
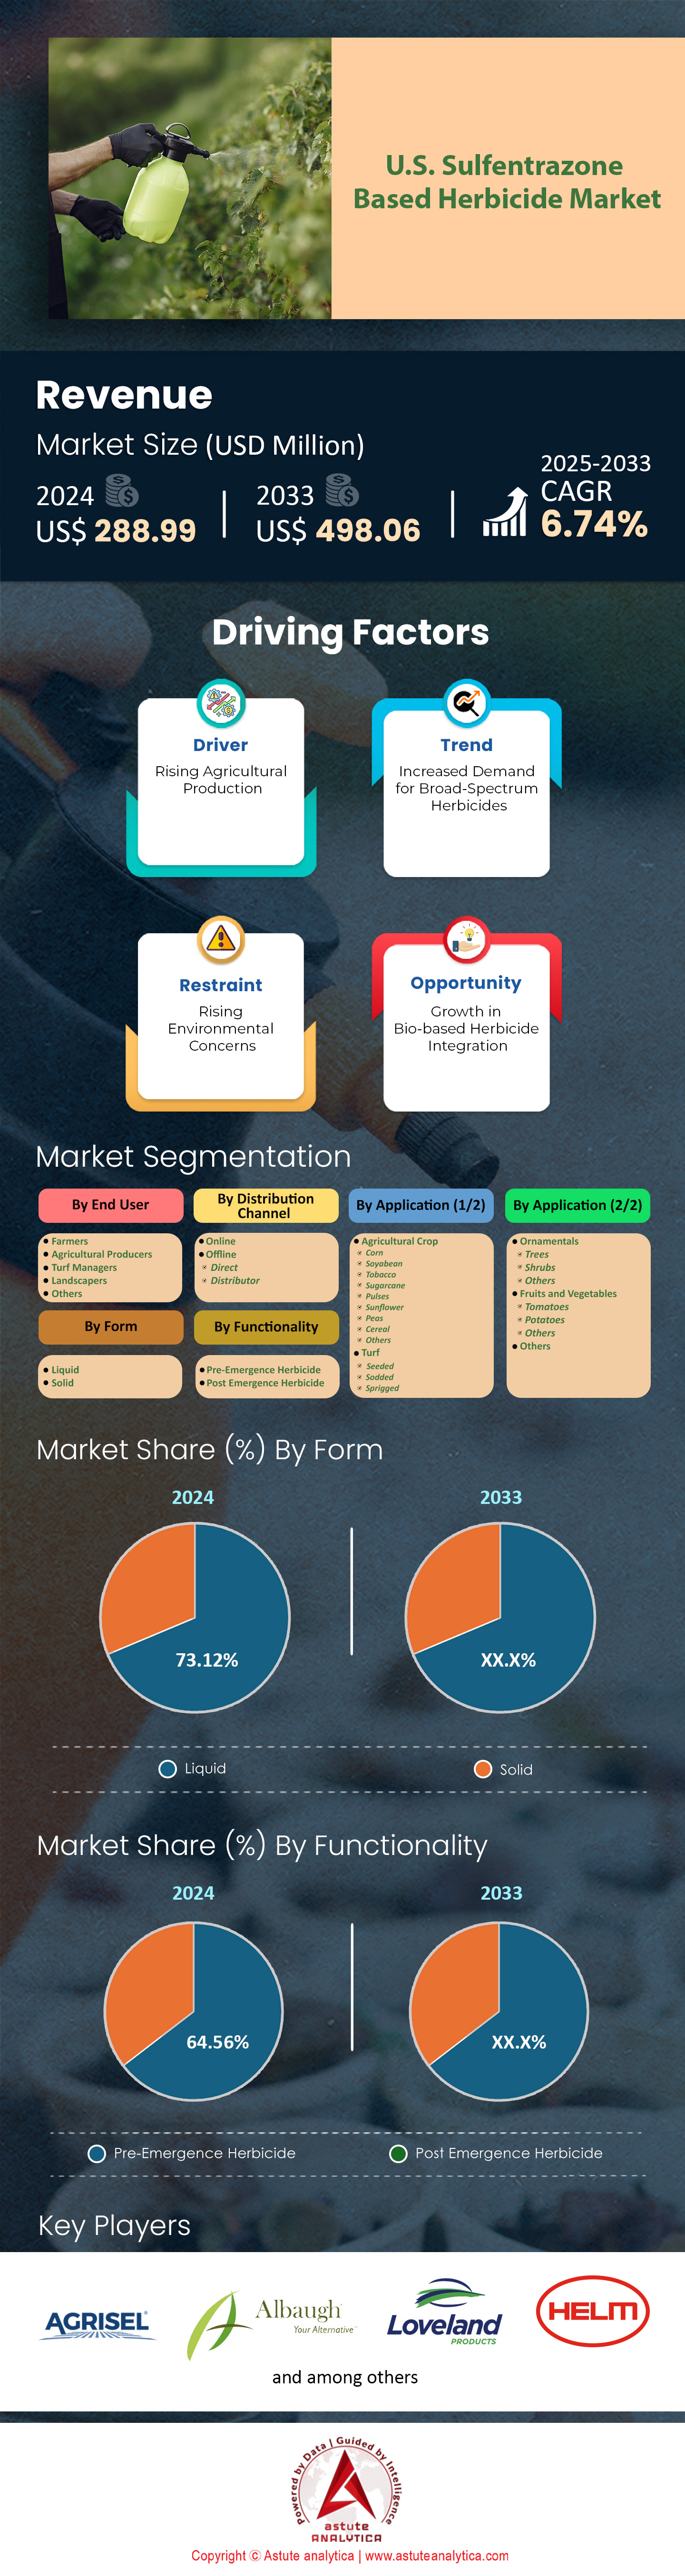
 Table 1 USA Agricultural Crop Care Products Market Size And Forecast, By Crop Type USA Turf and Ornamentals Care Products Market Size And Forecast, By Produce Type
Table 2 Driver: Rising Agricultural Production
Table 3 Market Dynamics And Trends
Table 4 Product Price Analysis: Form-based Price Analysis (2023):
Table 5 Competitive Dashboard : Key Players Share Analysis, By Turf (Revenue & Volume), 2020-2024 – By Generic Players (1/2)
Table 6 Competitive Dashboard : Key Players Share Analysis, By Turf (Revenue & Volume), 2020-2024 – By Branded Players (1/2)
Table 7 Competitive Dashboard: Key Players Share Analysis, By Ornamentals (Revenue & Volume), 2020-2024 – By Generic Players (1/2)
Table 8 Competitive Dashboard: Key Players Share Analysis, By Ornamentals (Revenue & Volume), 2020-2024 – By Branded Players (1/2)
Table 9 Competitive Dashboard: Key Players Share Analysis, By Agriculture Crop (Revenue & Volume), 2020-2024 – By Generic Players (1/2)
Table 10 Competitive Dashboard: Key Players Share Analysis, By Agriculture Crop (Revenue & Volume), 2020-2024 – By Branded Players (1/2)
Table 11 Competitive Dashboard: Competitor Mapping & Benchmarking
Table 12 USA Sulfentrazone Based Herbicide Market Size (US$ Mn), By Form, 2020-2033
Table 13 USA Sulfentrazone Based Herbicide Market Size (000' Tons), By Form, 2020-2033
Table 14 USA Sulfentrazone Based Herbicide Market Size (US$ Mn), By Functionality, 2020-2033
Table 15 USA Sulfentrazone Based Herbicide Market Size (000' Tons), By Functionality, 2020-2033
Table 16 USA Sulfentrazone Based Herbicide Market Size (US$ Mn), By Application, 2020-2033
Table 17 USA Sulfentrazone Based Herbicide Market Size (000' Tons), By Application, 2020-2033
Table 18 USA Sulfentrazone Based Herbicide Market Size (US$ Mn), By End User, 2020-2033
Table 19 USA Sulfentrazone Based Herbicide Market Size (000' Tons), By End User, 2020-2033
Table 20 USA Sulfentrazone Based Herbicide Market Size (US$ Mn), By Distribution Channel, 2020-2033
Table 21 USA Sulfentrazone Based Herbicide Market Size (000' Tons), By Distribution Channel, 2020-2033
Table 22 Agrisel USA, Incorporated: Offering
Table 23 Albaugh LLC: Offering
Table 24 Alligare LLC: Offering
Table 25 AMGUARD Environmental Technologies (American Vanguard Corporation): Offering
Table 26 American Vanguard Corporation (Parent Company) : Financial Analysis
Table 27 Atticus, LLC: Offering
Table 28 Quali-Pro: Offering
Table 29 Corteva, Inc.: Recent Developments
Table 30 Corteva, Inc.: Offering
Table 31 Corteva, Inc.: Financial Analysis
Table 32 FMC Corporation: Recent Developments
Table 33 FMC Corporation: Financial Analysis
Table 34 Generic Crop Science (Willowood USA): Offering
Table 35 Helena Agri-Enterprises, LLC: Offering
Table 36 HELM AG: Offering
Table 37 Innvictis Crop Care, LLC: Offering
Table 38 Loveland Products, Inc.: Offering
Table 39 Nufarm Limited: Recent Developments
Table 40 Nufarm Limited: Offering
Table 41 Nufarm Limited: Financial Analysis
Table 42 PBI-Gordon Companies, Inc.: Offering
Table 43 RedEagle International LLC: Offering
Table 44 RightLine LLC: Offering
Table 45 Sharda Cropchem Limited (Sharda USA LLC): Offering
Table 46 Sharda Cropchem Limited : Financial Analysis
Table 47 SummitAgro USA LLC: Offering
Table 48 Syngenta AG: Financial Analysis
Table 49 Tenkoz Inc.: Offering
Table 50 The Andersons, Inc.: Offering
Table 51 The Andersons, Inc.: Financial Analysis
Table 52 United Phosphorus Limited: Recent Developments
Table 53 United Phosphorus Limited: Offering
Table 54 United Phosphorus Limited: Financial Analysis
Table 55 Annexure: Secondary Sources
Figure 1 Executive Summary: USA Sulfentrazone Based Herbicides Market Size and Forecast, 2020-2033 (US$ Mn and 000’ Tons)
Figure 2 Executive Summary: Top Segments, CAGR % (2024-2033)
Figure 3 Industry Outlook: Overview of Agricultural Availability – USA
Figure 4 Industry Outlook: Industry Outlook: Overview of Agricultural Availability – USA
Figure 5 Industry Outlook: Overview of % of Farms and % of Land Farm Size Class (2022) – USA
Figure 6 Industry Outlook: USA Corn Production, By Year – In Billion Bushels
Figure 7 Industry Outlook: Overview of USA GDP Share Of Agriculture (%) – By Year
Figure 8 Industry Outlook: Importers of Herbicides, anti-sprouting products and plant-growth regulators from United States (2022) – By Import %
Figure 9 Adoption Analysis: Adoption Rate (%), By Form
Figure 10 Adoption Analysis: By Functionality, Revenue Comparison (US$ Mn)
Figure 11 Adoption Analysis: USA Sulfentrazone Based Herbicide Market, By Y-o-Y (%), 2021-2033
Figure 12 Competitive Dashboard (Generic Product): Market Share Analysis, By Company, Based on Revenue (2024)
Figure 13 Competitive Dashboard: Market Share Analysis, By Company, Based on Revenue (2024)
Figure 14 USA Sulfentrazone Based Herbicide Market, By Form, CAGR (%), 2024-2033
Figure 15 USA Sulfentrazone Based Herbicide Market Share (%), By Form, 2024
Figure 16 USA Sulfentrazone Based Herbicide Market Share (%), By Form, 2033
Figure 17 USA Sulfentrazone Based Herbicide Market, By Functionality, CAGR (%), 2024-2033
Figure 18 USA Sulfentrazone Based Herbicide Market Share (%), By Functionality, 2024
Figure 19 USA Sulfentrazone Based Herbicide Market Share (%), By Functionality, 2033
Figure 20 USA Sulfentrazone Based Herbicide Market, By Application, CAGR (%), 2024-2033
Figure 21 USA Sulfentrazone Based Herbicide Market Share (%), By Application, 2024
Figure 22 USA Sulfentrazone Based Herbicide Market Share (%), By Application, 2033
Figure 23 USA Sulfentrazone Based Herbicide Market, By End User, CAGR (%), 2024-2033
Figure 24 USA Sulfentrazone Based Herbicide Market Share (%), By End User, 2024
Figure 25 USA Sulfentrazone Based Herbicide Market Share (%), By End User, 2033
Figure 26 USA Sulfentrazone Based Herbicide Market, By Distribution Channel, CAGR (%), 2024-2033
Figure 27 USA Sulfentrazone Based Herbicide Market Share (%), By Distribution Channel, 2024
Figure 28 USA Sulfentrazone Based Herbicide Market Share (%), By Distribution Channel, 2033
Figure 29 AMGUARD EnvironmentalTechnologies(American Vanguard Corporation):Geographical Revenue Segmentation,2024
Figure 30 Corteva, Inc.: Business Revenue Segmentation, 2024
Figure 31 Corteva, Inc.: Geographical Revenue Segmentation, 2024
Figure 32 FMC Corporation: Business Revenue Segmentation, 2024
Figure 33 FMC Corporation: Geographical Revenue Segmentation, 2024
Figure 34 Nufarm Limited: Business Revenue Segmentation, 2024:
Figure 35 Nufarm Limited: Geographical Revenue Segmentation, 2024
Figure 36 Sharda Cropchem Limited (Sharda USA LLC): Business Revenue Segmentation, 2024
Figure 37 Sharda Cropchem Limited (Sharda USA LLC): Geographical Revenue Segmentation, 2024
Figure 38 Syngenta AG: Business Revenue Segmentation, 2024
Figure 39 Syngenta AG: Geographical Revenue Segmentation, 2024
Figure 40 The Andersons, Inc.: Business Revenue Segmentation, 2024
Figure 41 The Andersons, Inc.: Geographical Revenue Segmentation, 2024
Figure 42 United Phosphorus Limited: Business Revenue Segmentation, 2024
Figure 43 United Phosphorus Limited: Geographical Revenue Segmentation, 2024


Choose License Type


Features | Type of License | ||||
Data Book | Single User |   Multi User | Corporate | ||
| e-Access | ✓ | ✓ | ✓ | ✓ | |
User Sharing | 1 User Only | 1 User Only | Up to 7 Users | Unlimited User Access | |
⨉ | ⨉ | ⨉ | ✓ | ||
Free Customization | No Free Customization | Up To 30 hrs work | Up To 60 hrs work | Up To 80 hrs work | |
Deliverable |
| ⨉ | ✓ | ✓ | ✓ |
| ✓ | ⨉ | ✓ | ✓ | |
| ⨉ | ⨉ | ⨉ | ✓ | |
Analyst Support | 2-Months Analyst Support | 4-Months Analyst Support | 7-Months Analyst Support | One Year Analyst Support | |
Free Report update in next update cycle | ⨉ | ⨉ | ⨉ | ✓ | |
Free Industry Update (Within 180 days) | ⨉ | ⨉ | ⨉ | ✓ | |
Benefit | Up to 10% off on Post Purchase | Up to 20% off on Post Purchase | Up to 30% off on Post Purchase | Up to 40% off on Post Purchase | |