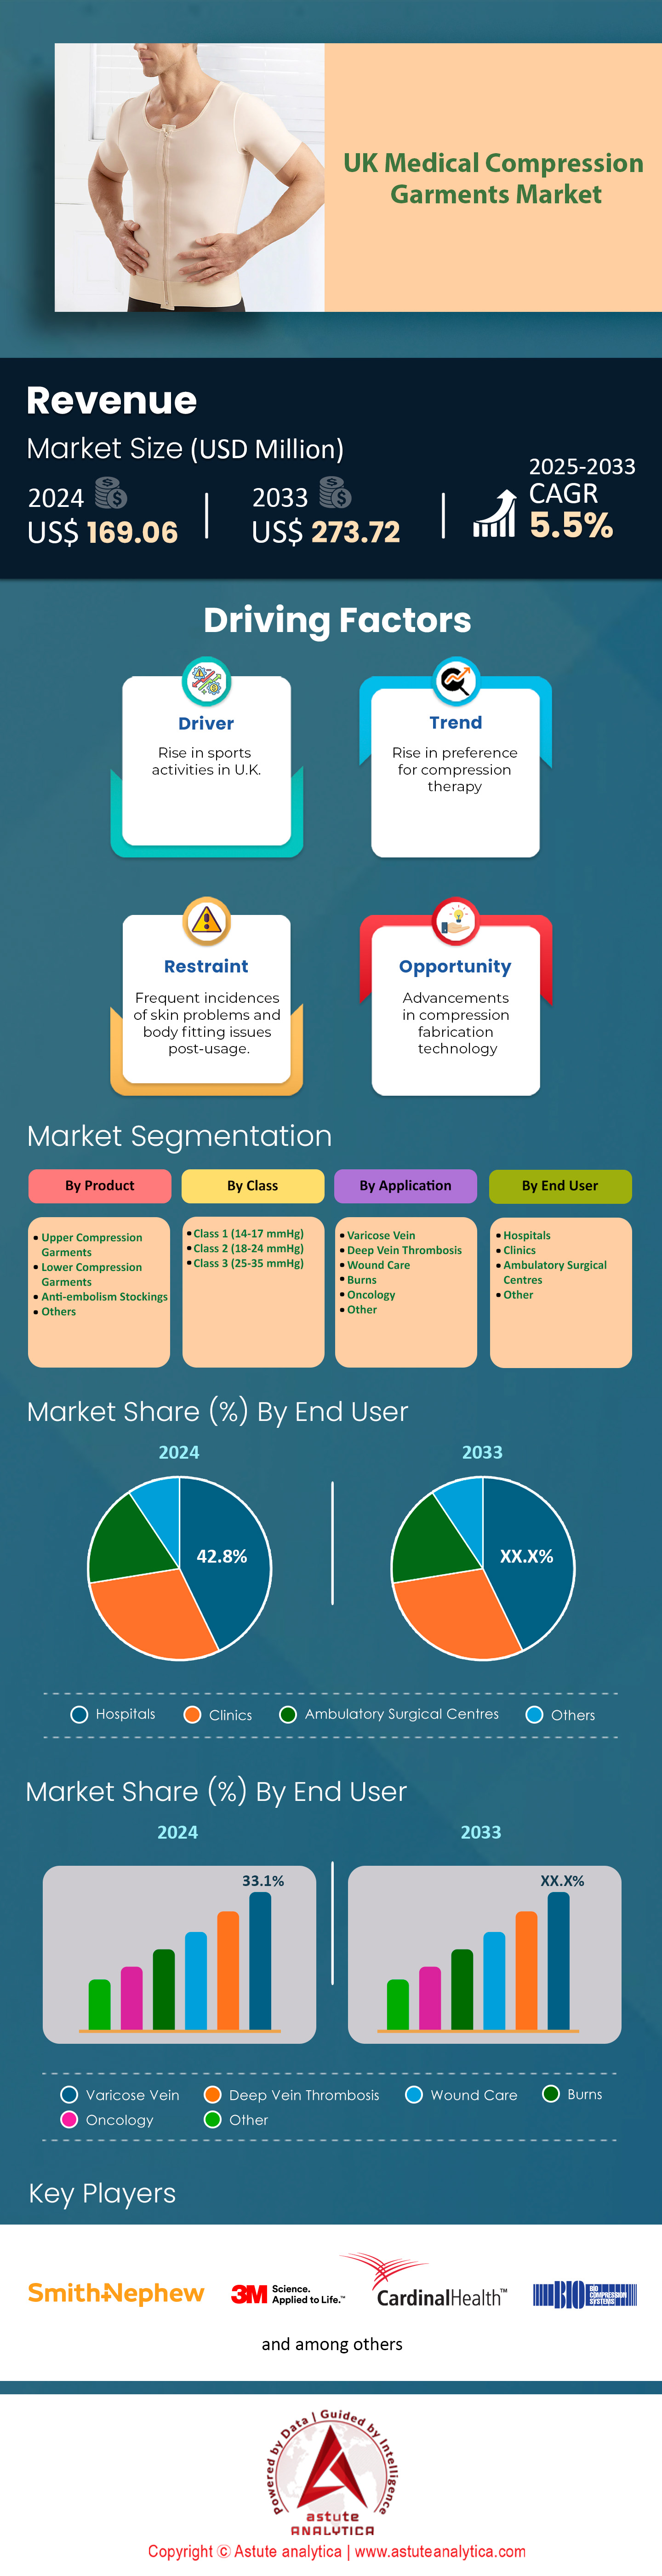
UK Medical Compression Garments Market: By Product (Upper Compression Garments, Lower Compression Garments, Anti-embolism Stockings, and Others); Class (Class 1 (14-17 mmHg), Class 2 (18-24 mmHg), and Class 3 (25-35 mmHg)); Application (Varicose Vein, Deep Vein Thrombosis, Wound Care, and Others); End User (Hospitals, Clinics, Ambulatory Surgical Centers, and Others)—Industry Dynamics, Market Size and Opportunity Forecast for 2025–2033
- Last Updated: Feb-2025 | Format:
![pdf]()
![powerpoint]()
![excel]() | Report ID: AA0522226 | Delivery: 2 to 4 Hours
| Report ID: AA0522226 | Delivery: 2 to 4 Hours


 | Report ID: AA0522226 | Delivery: 2 to 4 Hours
 Table 1 Market Dynamics And Trends-Trends: Impact Analysis of Market Dynamics
Table 2 Product Pricing Analysis: Price Analysis (Average Pricing, in US $)
Table 3 Competitive Dashboard: UK Medical Compression Garments Competitors Mapping & Benchmarking
Table 4 UK Medical Compression Garments Market Size (US$ Mn), By Product, 2020-2033
Table 5 UK Medical Compression Garments Market Size (000' Units), By Product, 2020-2033
Table 6 UK Medical Compression Garments Market Size (US$ Mn), By Class, 2020-2033
Table 7 UK Medical Compression Garments Market Size (000' Units), By Class, 2020-2033
Table 8 UK Medical Compression Garments Market Size (US$ Mn), By Application, 2020-2033
Table 9 UK Medical Compression Garments Market Size (000' Units), By Application, 2020-2033
Table 10 UK Medical Compression Garments Market Size (US$ Mn), By End User, 2020-2033
Table 11 UK Medical Compression Garments Market Size (000' Units), By End User, 2020-2033
Table 12 The 3m Company: Products
Table 13 The 3M Company: Financial Analysis
Table 14 Bio Compression System: Products
Table 15 Cardinal Health, Inc.: Products
Table 16 Cardinal Health, Inc.: Financial Analysis
Table 17 Essity Ab (Bsn Medical Gmbh): Products
Table 18 Essity AB (BSN medical GmbH): Financial Analysis
Table 19 Eurosurgical Ltd: Products
Table 20 Judd Medical: Products
Table 21 Juzo: Products
Table 22 Lipoelastic: Products
Table 23 Medasun Medical: Products
Table 24 Medi Gmbh And Co. Kg: Products
Table 25 Sigvaris, Inc.: Products
Table 26 Smith And Nephew Plc.: Products
Table 27 Smith And Nephew Plc.: Financial Analysis
Table 28 Other Prominent Players
Figure 1 Market Revenue Estimates And Forecast: Market Revenue Estimates And Forecast (Us$ Mn), 2017 – 2033
Figure 2 Market Volume Estimates And Forecast: Market Volume Estimates And Forecast (000’ Units), 2017 – 2033
Figure 3 Executive Summary: Upper Compression Garments segment dominates the Medical Compression Garments Market
Figure 4 Executive Summary: UK Medical Compression Garments Market Share 2024 & 2033
Figure 5 Market Dynamics And Trends-Driver: Uk A&E Attendances And Emergency Admissions In March, 2017-2022
Figure 6 Market Dynamics And Trends-Driver: Taken part at least twice in the last 28 days (age 16+) for selected activity groups, 2017-2024, in millions
Figure 7 Covid -19 Impact & Recovery: UK Medical Compression Garments Market, Covid-19 Impact & Recovery, 2017-2033, (in %)
Figure 8 Competitive Dashboard: Market Share Analysis by Company, Based on Revenue (2020)
Figure 9 UK Medical Compression Garments Market, By Product, CAGR (%), 2024-2033
Figure 10 UK Medical Compression Garments Market Share (%), By Product, 2024
Figure 11 UK Medical Compression Garments Market Share (%), By Product, 2033
Figure 12 UK Medical Compression Garments Market, By Class, CAGR (%), 2024-2033
Figure 13 UK Medical Compression Garments Market Share (%), By Class, 2024
Figure 14 UK Medical Compression Garments Market Share (%), By Class, 2033
Figure 15 UK Medical Compression Garments Market, By Application, CAGR (%), 2024-2033
Figure 16 UK Medical Compression Garments Market Share (%), By Application, 2024
Figure 17 UK Medical Compression Garments Market Share (%), By Application, 2033
Figure 18 UK Medical Compression Garments Market, By End User, CAGR (%), 2024-2033
Figure 19 UK Medical Compression Garments Market Share (%), By End User, 2024
Figure 20 UK Medical Compression Garments Market Share (%), By End User, 2033
Figure 21 3M Company: Business Revenue Segmentation, 2024
Figure 22 3M Company: Geographical Revenue Segmentation, 2024
Figure 23 Cardinal Health, Inc.: Business Revenue Segmentation, 2024
Figure 24 Cardinal Health, Inc.: Geographical Revenue Segmentation, 2024
Figure 25 Essity AB (BSN medical GmbH): Business Revenue Segmentation, 2024
Figure 26 Essity AB (BSN medical GmbH): Geographical Revenue Segmentation, 2024
Figure 27 Smith and Nephew Plc.: Business Revenue Segmentation, 2024
Figure 28 Smith and Nephew Plc.: Geographical Revenue Segmentation, 2024


Choose License Type


Features | Type of License | ||||
Data Book | Single User |   Multi User | Corporate | ||
| e-Access | ✓ | ✓ | ✓ | ✓ | |
User Sharing | 1 User Only | 1 User Only | Up to 7 Users | Unlimited User Access | |
⨉ | ⨉ | ⨉ | ✓ | ||
Free Customization | No Free Customization | Up To 30 hrs work | Up To 60 hrs work | Up To 80 hrs work | |
Deliverable |
| ⨉ | ✓ | ✓ | ✓ |
| ✓ | ⨉ | ✓ | ✓ | |
| ⨉ | ⨉ | ⨉ | ✓ | |
Analyst Support | 2-Months Analyst Support | 4-Months Analyst Support | 7-Months Analyst Support | One Year Analyst Support | |
Free Report update in next update cycle | ⨉ | ⨉ | ⨉ | ✓ | |
Free Industry Update (Within 180 days) | ⨉ | ⨉ | ⨉ | ✓ | |
Benefit | Up to 10% off on Post Purchase | Up to 20% off on Post Purchase | Up to 30% off on Post Purchase | Up to 40% off on Post Purchase | |