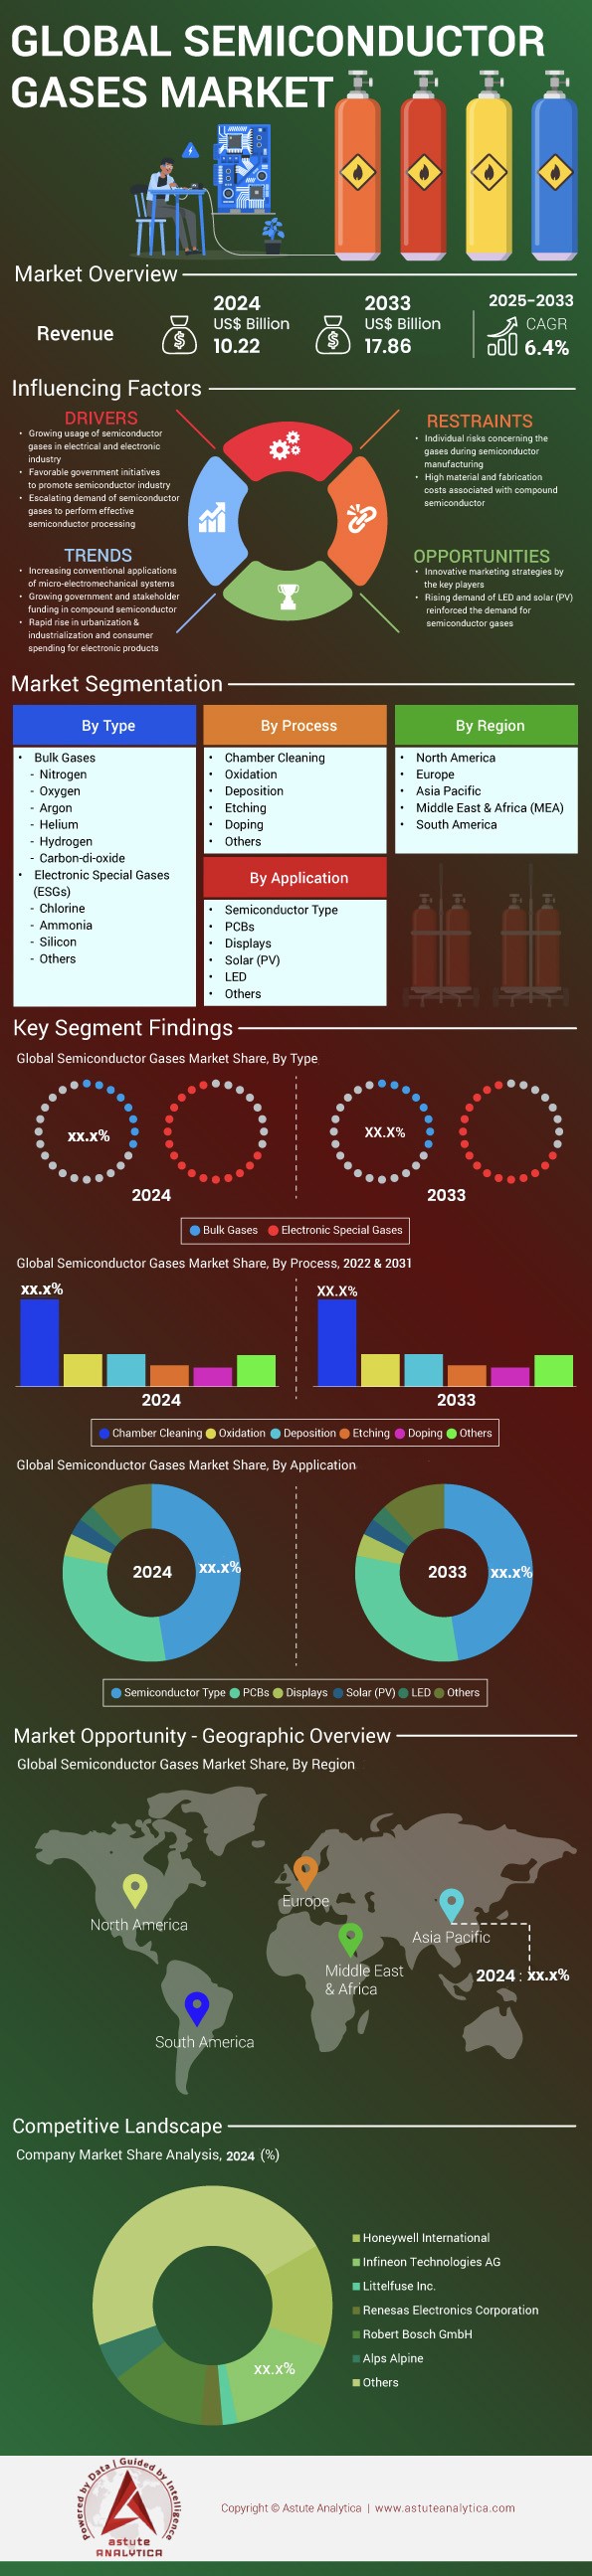
Semiconductor Gases Market: By Type (Bulk Gases and Electronic Special Gases (ESGs); Process (Chamber Cleaning, Oxidation, Deposition, Etching, Doping and Others); Application (Semiconductor Type, PCBs, Displays, Solar (PV), LED and Others) ; Region—Market Size, Industry Dynamics, Opportunity Analysis and Forecast for 2025–2033
- Last Updated: Jan-2025 | Format:
![pdf]()
![powerpoint]()
![excel]() | Report ID: AA0322161 | Delivery: 2 to 4 Hours
| Report ID: AA0322161 | Delivery: 2 to 4 Hours


 | Report ID: AA0322161 | Delivery: 2 to 4 Hours
 Table 1:Global Semiconductor Gases Market Size (US$ Bn), by Type, 2020-2033
Table 2:Global Semiconductor Gases Market Size (US$ Bn), by Process, 2020-2033
Table 3:Global Semiconductor Gases Market Size (US$ Bn), by Application, 2020-2033
Table 4:Global Semiconductor Gases Market Size (US$ Bn), By Geography, 2020-2033
Table 5:North America Semiconductor Gases Market Size (US$ Bn), By Country, 2020-2033
Table 6:North America Semiconductor Gases Market Size (US$ Bn), by Type, 2020-2033
Table 7:North America Semiconductor Gases Market Size (US$ Bn), by Process, 2020-2033
Table 8:North America Semiconductor Gases Market Size (US$ Bn), by Application, 2020-2033
Table 9:Europe Semiconductor Gases Market Size (US$ Bn), By Country, 2020-2033
Table 10:Europe Semiconductor Gases Market Size (US$ Bn), by Type, 2020-2033
Table 11:Europe Semiconductor Gases Market Size (US$ Bn), by Process, 2020-2033
Table 12:Europe Semiconductor Gases Market Size (US$ Bn), by Application, 2020-2033
Table 13:Asia Pacific Semiconductor Gases Market Size (US$ Bn), By Country, 2020-2033
Table 14:Asia Pacific Semiconductor Gases Market Size (US$ Bn), by Type, 2020-2033
Table 15:Asia Pacific Semiconductor Gases Market Size (US$ Bn), by Process, 2020-2033
Table 16:Asia Pacific Semiconductor Gases Market Size (US$ Bn), by Application, 2020-2033
Table 17:Middle East & Africa Semiconductor Gases Market Size (US$ Bn), By Country, 2020-2033
Table 18:Middle East & Africa Semiconductor Gases Market Size (US$ Bn), by Type, 2020-2033
Table 19:Middle East & Africa Semiconductor Gases Market Size (US$ Bn), by Process, 2020-2033
Table 20:Middle East & Africa Semiconductor Gases Market Size (US$ Bn), by Application, 2020-2033
Table 21:South America Semiconductor Gases Market Size (US$ Bn), By Country, 2020-2033
Table 22:South America Semiconductor Gases Market Size (US$ Bn), by Type, 2020-2033
Table 23:South America Semiconductor Gases Market Size (US$ Bn), by Process, 2020-2033
Table 24:South America Semiconductor Gases Market Size (US$ Bn), by Application, 2020-2033
Table 25:Iwatani Corporation: Financial Analysis
Table 26:Linde plc: Financial Analysis
Table 27:Air Liquide SA: Financial Analysis
Table 28:Air Products and Chemicals, Inc.: Financial Analysis
Table 29:Messer Group: Financial Analysis
Table 30:Mitsui Chemicals, Inc.: Financial Analysis
Table 31:REC Silicon ASA: Financial Analysis
Table 32:Sumitomo Seika Chemicals Company, Ltd.: Financial Analysis
Figure1:Executive Summary: Global Semiconductor Gases Market Size, By Value, 2024-2033 (US$ Billion)
Figure2:Executive Summary: Global Semiconductor Gases Market Size, By YoY Growth, 2024-2033 (%)
Figure3:Smartphone Adoption during 2017 and 2025 (in %)
Figure4:COVID-19 Impact Assessment on Market Growth Trend: Analysis
Figure5:Industry Outlook: Global Semiconductor Gases Market Value and Volume, 2024
Figure6:Industry Outlook: Global Semiconductor Gases Market Volume, 2024
Figure7:Competitive Dashboard: Market Share Analysis, By Company, Based on Revenue (2024)
Figure8:Market Revenue Estimates and Forecast (US$ Mn), 2017 – 2033
Figure9:Global Semiconductor Gases Market, By Type, CAGR (%), 2024-2033
Figure10:Global Semiconductor Gases Market Share (%), by Type, 2024
Figure11:Global Semiconductor Gases Market Share (%), by Type, 2033
Figure12:Global Semiconductor Gases Market, By Process, CAGR (%), 2024-2033
Figure13:Global Semiconductor Gases Market Share (%), by Process, 2024
Figure14:Global Semiconductor Gases Market Share (%), by Process, 2033
Figure15:Global Semiconductor Gases Market, By Application, CAGR (%), 2024-2033
Figure16:Global Semiconductor Gases Market Share (%), by Application, 2024
Figure17:Global Semiconductor Gases Market Share (%), By Application, 2033
Figure18:Global Semiconductor Gases Market, Top Segment CAGR (%), 2024-2033
Figure19:Global Semiconductor Gases Market Share (%), by Geography, 2024
Figure20:Global Semiconductor Gases Market Share (%), by Geography, 2033
Figure21:North America Semiconductor Gases Market, Top Segment CAGR (%), 2024-2033
Figure22:North America Semiconductor Gases Market Share (%), by Country, 2024
Figure23:North America Semiconductor Gases Market Share (%), by Country, 2033
Figure24:North America Semiconductor Gases Market Share (%), by Type, 2024
Figure25:North America Semiconductor Gases Market Share (%), by Type, 2033
Figure26:North America Semiconductor Gases Market Share (%), by Process, 2024
Figure27:North America Semiconductor Gases Market Share (%), by Process, 2033
Figure28:North America Semiconductor Gases Market Share (%), by Application, 2024
Figure29:North America Semiconductor Gases Market Share (%), By Application, 2033
Figure30:Europe Semiconductor Gases Market, Top Segment CAGR (%), 2024-2033
Figure31:Europe Semiconductor Gases Market Share (%), by Country, 2024
Figure32:Europe Semiconductor Gases Market Share (%), by Country, 2033
Figure33:Europe Semiconductor Gases Market Share (%), by Type, 2024
Figure34:Europe Semiconductor Gases Market Share (%), by Type, 2033
Figure35:Europe Semiconductor Gases Market Share (%), by Process, 2024
Figure36:Europe Semiconductor Gases Market Share (%), by Process, 2033
Figure37:Europe Semiconductor Gases Market Share (%), by Application, 2024
Figure38:Europe Semiconductor Gases Market Share (%), By Application, 2033
Figure39:Asia Pacific Semiconductor Gases Market, Top Segment CAGR (%), 2024-2033
Figure40:Asia Pacific Semiconductor Gases Market Share (%), by Country, 2024
Figure41:Asia Pacific Semiconductor Gases Market Share (%), by Country, 2033
Figure42:Asia Pacific Semiconductor Gases Market Share (%), by Type, 2024
Figure43:Asia Pacific Semiconductor Gases Market Share (%), by Type, 2033
Figure44:Asia Pacific Semiconductor Gases Market Share (%), by Process, 2024
Figure45:Asia Pacific Semiconductor Gases Market Share (%), by Process, 2033
Figure46:Asia Pacific Semiconductor Gases Market Share (%), by Application, 2024
Figure47:Asia Pacific Semiconductor Gases Market Share (%), By Application, 2033
Figure48:Middle East & Africa Semiconductor Gases Market, Top Segment CAGR (%), 2024-2033
Figure49:Middle East & Africa Semiconductor Gases Market Share (%), by Country, 2024
Figure50:Middle East & Africa Semiconductor Gases Market Share (%), by Country, 2033
Figure51:Middle East & Africa Semiconductor Gases Market Share (%), by Type, 2024
Figure52:Middle East & Africa Semiconductor Gases Market Share (%), by Type, 2033
Figure53:Middle East & Africa Semiconductor Gases Market Share (%), by Process, 2024
Figure54:Middle East & Africa Semiconductor Gases Market Share (%), by Process, 2033
Figure55:Middle East & Africa Semiconductor Gases Market Share (%), by Application, 2024
Figure56:Middle East & Africa Semiconductor Gases Market Share (%), By Application, 2033
Figure57:South America Semiconductor Gases Market, Top Segment CAGR (%), 2024-2033
Figure58:South America Semiconductor Gases Market Share (%), by Country, 2024
Figure59:South America Semiconductor Gases Market Share (%), by Country, 2033
Figure60:South America Semiconductor Gases Market Share (%), by Type, 2024
Figure61:South America Semiconductor Gases Market Share (%), by Type, 2033
Figure62:South America Semiconductor Gases Market Share (%), by Process, 2024
Figure63:South America Semiconductor Gases Market Share (%), by Process, 2033
Figure64:South America Semiconductor Gases Market Share (%), by Application, 2024
Figure65:South America Semiconductor Gases Market Share (%), By Application, 2033
Figure66:Iwatani Corporation: Business Revenue Segmentation, 2024
Figure67:Linde plc: Geographical Revenue Segmentation, 2024
Figure68:Linde plc: Business Revenue Segmentation, 2024
Figure69:Air Liquide SA: Geographical Revenue Segmentation, 2024
Figure70:Air Liquide SA: Business Revenue Segmentation, 2024
Figure71:Air Products and Chemicals, Inc.: Geographical Revenue Segmentation, 2024
Figure72:Air Products and Chemicals, Inc.: Business Revenue Segmentation, 2024
Figure73:Messer Group: Geographical Revenue Segmentation, 2024
Figure74:Mitsui Chemicals, Inc.: Business Revenue Segmentation, 2024
Figure75:Mitsui Chemicals, Inc.: Geographical Revenue Segmentation, 2024
Figure76:REC Silicon ASA: Geographical Revenue Segmentation, 2024
Figure77:Sumitomo Seika Chemicals Company, Ltd.: Business Revenue Segmentation, 2024
Figure78:Sumitomo Seika Chemicals Company, Ltd.: Geographical Revenue Segmentation, 2024


Choose License Type


Features | Type of License | ||||
Data Book | Single User |   Multi User | Corporate | ||
| e-Access | ✓ | ✓ | ✓ | ✓ | |
User Sharing | 1 User Only | 1 User Only | Up to 7 Users | Unlimited User Access | |
⨉ | ⨉ | ⨉ | ✓ | ||
Free Customization | No Free Customization | Up To 30 hrs work | Up To 60 hrs work | Up To 80 hrs work | |
Deliverable |
| ⨉ | ✓ | ✓ | ✓ |
| ✓ | ⨉ | ✓ | ✓ | |
| ⨉ | ⨉ | ⨉ | ✓ | |
Analyst Support | 2-Months Analyst Support | 4-Months Analyst Support | 7-Months Analyst Support | One Year Analyst Support | |
Free Report update in next update cycle | ⨉ | ⨉ | ⨉ | ✓ | |
Free Industry Update (Within 180 days) | ⨉ | ⨉ | ⨉ | ✓ | |
Benefit | Up to 10% off on Post Purchase | Up to 20% off on Post Purchase | Up to 30% off on Post Purchase | Up to 40% off on Post Purchase | |