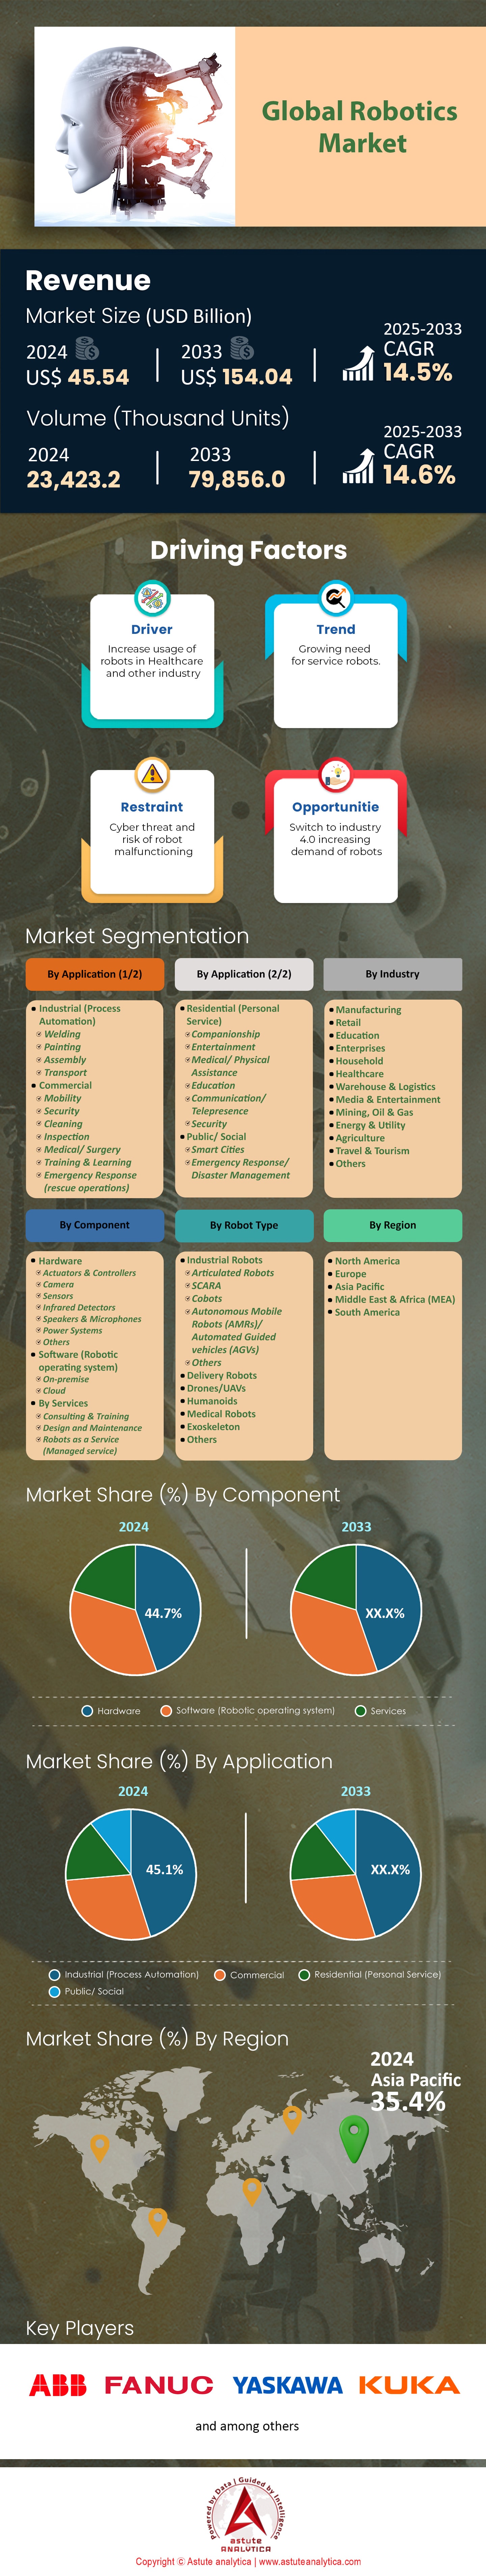
Robotics Market: By Component (Hardware (Actuators & Controllers, Camera, Sensors, Infrared Detectors, Speakers & Microphones, Power Systems, Others), Software (Robotic operating system) (On-premise and Cloud), Services (Consulting & Training, Design and Maintenance, Robots as a Service (Managed service)); Robot Type (Industrial Robots (Articulated Robots, SCARA, Cobots, Autonomous Mobile Robots (AMRs)/ Automated Guided vehicles (AGVs), Others), Delivery Robots, Drones/UAVs, Humanoids, Medical Robots, Exoskeleton, Others)); Application (Industrial (Process Automation) (Welding, Painting, Assembly, Transport), Commercial (Mobility, Security, Cleaning, Inspection, Medical/ Surgery, Training & Learning, Emergency Response (rescue operations)), Residential (Personal Service) (Companionship, Entertainment, Medical/ Physical Assistance, Education, Communication/ Telepresence, Security, Public/ Social, Smart Cities, Emergency Response/ Disaster Management)); Industry (Manufacturing, Retail, Education, Enterprises, Household, Healthcare, Warehouse & Logistics, Media & Entertainment, Mining, Oil & Gas, Energy & Utility, Agriculture, Travel & Tourism, Others); Region—Market Size, Industry Dynamics, Opportunity Analysis and Forecast for 2025–2033
- Last Updated: Dec-2024 | Format:
![pdf]()
![powerpoint]()
![excel]() | Report ID: AA1224994 | Delivery: 2 to 4 Hours
| Report ID: AA1224994 | Delivery: 2 to 4 Hours


 | Report ID: AA1224994 | Delivery: 2 to 4 Hours
 Table: 1 Industry Outlook: Robotics Process Automation Adoption
Table: 2 Market Dynamics and Trends: Impact Analysis of Market Dynamics
Table: 3 Market Dynamics and Trends: Driver: Growth Rate of Robots
Table: 4 Product Price Analysis: Price Analysis, By Component (Average Pricing, in US $)
Table: 5 Competitive Dashboard: Global Robotics Market Competitors Mapping & Benchmarking
Table: 6 Global Robotics Market Size (US$ Bn), By Component, 2020-2033
Table: 7 Global Robotics Market Size (Thousand Units), By Component, 2020-2033
Table: 8 Global Robotics Market Size (US$ Bn), By Robot Type, 2020-2033
Table: 9 Global Robotics Market Size (Thousand Units), By Robot Type, 2020-2033
Table: 10 Global Robotics Market Size (US$ Bn), By Application, 2020-2033
Table: 11 Global Robotics Market Size (Thousand Units), By Application, 2020-2033
Table: 12 Global Robotics Market Size (US$ Bn), By Industry, 2020-2033
Table: 13 Global Robotics Market Size (Thousand Units), By Industry, 2020-2033
Table: 14 Global Robotics Market Size (US$ Bn), By Region, 2020-2033
Table: 15 Global Robotics Market Size (Thousand Units), By Region, 2020-2033
Table: 16 North America Robotics Market Size (US$ Bn), By Country, 2020-2033
Table: 17 North America Robotics Market Size (Thousand Units), By Country, 2020-2033
Table: 18 North America Robotics Market Size (US$ Bn), By Component, 2020-2033
Table: 19 North America Robotics Market Size (Thousand Units), By Component, 2020-2033
Table: 20 North America Robotics Market Size (US$ Bn), By Robot Type, 2020-2033
Table: 21 North America Robotics Market Size (Thousand Units), By Robot Type, 2020-2033
Table: 22 North America Robotics Market Size (US$ Bn), By Application, 2020-2033
Table: 23 North America Robotics Market Size (Thousand Units), By Application, 2020-2033
Table: 24 North America Robotics Market Size (US$ Bn), By Industry, 2020-2033
Table: 25 North America Robotics Market Size (Thousand Units), By Industry, 2020-2033
Table: 26 Europe Robotics Market Size (US$ Bn), By Country, 2020-2033
Table: 27 Europe Robotics Market Size (Thousand Units), By Country, 2020-2033
Table: 28 Europe Robotics Market Size (US$ Bn), By Component, 2020-2033
Table: 29 Europe Robotics Market Size (Thousand Units), By Component, 2020-2033
Table: 30 Europe Robotics Market Size (US$ Bn), By Robot Type, 2020-2033
Table: 31 Europe Robotics Market Size (Thousand Units), By Robot Type, 2020-2033
Table: 32 Europe Robotics Market Size (US$ Bn), By Application, 2020-2033
Table: 33 Europe Robotics Market Size (Thousand Units), By Application, 2020-2033
Table: 34 Europe Robotics Market Size (US$ Bn), By Industry, 2020-2033
Table: 35 Europe Robotics Market Size (Thousand Units), By Industry, 2020-2033
Table: 36 Asia Pacific Robotics Market Size (US$ Bn), By Country, 2020-2033
Table: 37 Asia Pacific Robotics Market Size (Thousand Units), By Country, 2020-2033
Table: 38 Asia Pacific Robotics Market Size (US$ Bn), By Component, 2020-2033
Table: 39 Asia Pacific Robotics Market Size (Thousand Units), By Component, 2020-2033
Table: 40 Asia Pacific Robotics Market Size (US$ Bn), By Robot Type, 2020-2033
Table: 41 Asia Pacific Robotics Market Size (Thousand Units), By Robot Type, 2020-2033
Table: 42 Asia Pacific Robotics Market Size (US$ Bn), By Application, 2020-2033
Table: 43 Asia Pacific Robotics Market Size (Thousand Units), By Application, 2020-2033
Table: 44 Asia Pacific Robotics Market Size (US$ Bn), By Industry, 2020-2033
Table: 45 Asia Pacific Robotics Market Size (Thousand Units), By Industry, 2020-2033
Table: 46 Middle East & Africa Robotics Market Size (US$ Bn), By Country, 2020-2033
Table: 47 Middle East & Africa Robotics Market Size (Thousand Units), By Country, 2020-2033
Table: 48 Middle East & Africa Robotics Market Size (US$ Bn), By Component, 2020-2033
Table: 49 Middle East & Africa Robotics Market Size (Thousand Units), By Component, 2020-2033
Table: 50 Middle East & Africa Robotics Market Size (US$ Bn), By Robot Type, 2020-2033
Table: 51 Middle East & Africa Robotics Market Size (Thousand Units), By Robot Type, 2020-2033
Table: 52 Middle East & Africa Robotics Market Size (US$ Bn), By Application, 2020-2033
Table: 53 Middle East & Africa Robotics Market Size (Thousand Units), By Application, 2020-2033
Table: 54 Middle East & Africa Robotics Market Size (US$ Bn), By Industry, 2020-2033
Table: 55 Middle East & Africa Robotics Market Size (Thousand Units), By Industry, 2020-2033
Table: 56 South America Robotics Market Size (US$ Bn), By Country, 2020-2033
Table: 57 South America Robotics Market Size (Thousand Units), By Country, 2020-2033
Table: 58 South America Robotics Market Size (US$ Bn), By Component, 2020-2033
Table: 59 South America Robotics Market Size (Thousand Units), By Component, 2020-2033
Table: 60 South America Robotics Market Size (US$ Bn), By Robot Type, 2020-2033
Table: 61 South America Robotics Market Size (Thousand Units), By Robot Type, 2020-2033
Table: 62 South America Robotics Market Size (US$ Bn), By Application, 2020-2033
Table: 63 South America Robotics Market Size (Thousand Units), By Application, 2020-2033
Table: 64 South America Robotics Market Size (US$ Bn), By Industry, 2020-2033
Table: 65 South America Robotics Market Size (Thousand Units), By Industry, 2020-2033
Table: 66 China Robotics Market Size (US$ Bn), By Component, 2020-2033
Table: 67 China Robotics Market Size (Thousand Units), By Component, 2020-2033
Table: 68 China Robotics Market Size (US$ Bn), By Robot Type, 2020-2033
Table: 69 China Robotics Market Size (Thousand Units), By Robot Type, 2020-2033
Table: 70 China Robotics Market Size (US$ Bn), By Application, 2020-2033
Table: 71 China Robotics Market Size (Thousand Units), By Application, 2020-2033
Table: 72 China Robotics Market Size (US$ Bn), By Industry, 2020-2033
Table: 73 China Robotics Market Size (Thousand Units), By Industry, 2020-2033
Table: 74 India Robotics Market Size (US$ Bn), By Component, 2020-2033
Table: 75 India Robotics Market Size (Thousand Units), By Component, 2020-2033
Table: 76 India Robotics Market Size (US$ Bn), By Robot Type, 2020-2033
Table: 77 India Robotics Market Size (Thousand Units), By Robot Type, 2020-2033
Table: 78 India Robotics Market Size (US$ Bn), By Application, 2020-2033
Table: 79 India Robotics Market Size (Thousand Units), By Application, 2020-2033
Table: 80 India Robotics Market Size (US$ Bn), By Industry, 2020-2033
Table: 81 India Robotics Market Size (Thousand Units), By Industry, 2020-2033
Table: 82 Japan Robotics Market Size (US$ Bn), By Component, 2020-2033
Table: 83 Japan Robotics Market Size (Thousand Units), By Component, 2020-2033
Table: 84 Japan Robotics Market Size (US$ Bn), By Robot Type, 2020-2033
Table: 85 Japan Robotics Market Size (Thousand Units), By Robot Type, 2020-2033
Table: 86 Japan Robotics Market Size (US$ Bn), By Application, 2020-2033
Table: 87 Japan Robotics Market Size (Thousand Units), By Application, 2020-2033
Table: 88 Japan Robotics Market Size (US$ Bn), By Industry, 2020-2033
Table: 89 Japan Robotics Market Size (Thousand Units), By Industry, 2020-2033
Table: 90 ASEAN Robotics Market Size (US$ Bn), By Component, 2020-2033
Table: 91 ASEAN Robotics Market Size (Thousand Units), By Component, 2020-2033
Table: 92 ASEAN Robotics Market Size (US$ Bn), By Robot Type, 2020-2033
Table: 93 ASEAN Robotics Market Size (Thousand Units), By Robot Type, 2020-2033
Table: 94 ASEAN Robotics Market Size (US$ Bn), By Application, 2020-2033
Table: 95 ASEAN Robotics Market Size (Thousand Units), By Application, 2020-2033
Table: 96 ASEAN Robotics Market Size (US$ Bn), By Industry, 2020-2033
Table: 97 ASEAN Robotics Market Size (Thousand Units), By Industry, 2020-2033
Table: 98 Singapore Robotics Market Size (US$ Bn), By Component, 2020-2033
Table: 99 Singapore Robotics Market Size (Thousand Units), By Component, 2020-2033
Table: 100 Singapore Robotics Market Size (US$ Bn), By Robot Type, 2020-2033
Table: 101 Singapore Robotics Market Size (Thousand Units), By Robot Type, 2020-2033
Table: 102 Singapore Robotics Market Size (US$ Bn), By Application, 2020-2033
Table: 103 Singapore Robotics Market Size (Thousand Units), By Application, 2020-2033
Table: 104 Singapore Robotics Market Size (US$ Bn), By Industry, 2020-2033
Table: 105 Singapore Robotics Market Size (Thousand Units), By Industry, 2020-2033
Table: 106 Indonesia Robotics Market Size (US$ Bn), By Component, 2020-2033
Table: 107 Indonesia Robotics Market Size (Thousand Units), By Component, 2020-2033
Table: 108 Indonesia Robotics Market Size (US$ Bn), By Robot Type, 2020-2033
Table: 109 Indonesia Robotics Market Size (Thousand Units), By Robot Type, 2020-2033
Table: 110 Indonesia Robotics Market Size (US$ Bn), By Application, 2020-2033
Table: 111 Indonesia Robotics Market Size (Thousand Units), By Application, 2020-2033
Table: 112 Indonesia Robotics Market Size (US$ Bn), By Industry, 2020-2033
Table: 113 Indonesia Robotics Market Size (Thousand Units), By Industry, 2020-2033
Table: 114 South Korea Robotics Market Size (US$ Bn), By Component, 2020-2033
Table: 115 South Korea Robotics Market Size (Thousand Units), By Component, 2020-2033
Table: 116 South Korea Robotics Market Size (US$ Bn), By Robot Type, 2020-2033
Table: 117 South Korea Robotics Market Size (Thousand Units), By Robot Type, 2020-2033
Table: 118 South Korea Robotics Market Size (US$ Bn), By Application, 2020-2033
Table: 119 South Korea Robotics Market Size (Thousand Units), By Application, 2020-2033
Table: 120 South Korea Robotics Market Size (US$ Bn), By Industry, 2020-2033
Table: 121 South Korea Robotics Market Size (Thousand Units), By Industry, 2020-2033
Table: 122 ABB LTD: Products
Table: 123 ABB LTD: Financial Analysis
Table: 124 Blue Ocean Robotics: Products
Table: 125 DENSO: Products
Table: 126 DENSO: Financial Analysis
Table: 127 Fanuc Corporation: Products
Table: 128 Fanuc Corporation: Financial Analysis
Table: 129 Fetch Robotics, Inc.: Products
Table: 130 Fetch Robotics, Inc.: Recent Developments
Table: 131 Omron Corporation: Products
Table: 132 Omron Corporation: Financial Analysis
Table: 133 RoboAds: Products
Table: 134 RoboAds: Recent Development
Table: 135 Seiko Epson Corporation: Products
Table: 136 Seiko Epson Corporation: Financial Analysis
Table: 137 Simbe Robotics, Inc.: Products
Table: 138 Simbe Robotics, Inc.: Recent Development
Table: 139 Yaskawa Electric Corporation: Products
Table: 140 Yaskawa Electric Corporation: Financial Analysis
Table: 141 Comau: Products
Table: 142 Comau: Recent Development
Table: 143 Honeywell International Inc.: Products
Table: 144 Honeywell International Inc.: Financial Analysis
Table: 145 Kawasaki Heavy Industries, Ltd.: Products
Table: 146 Kawasaki Heavy Industries, Ltd.: Financial Analysis
Table: 147 Mitsubishi Electric Corporation: Products
Table: 148 Mitsubishi Electric Corporation: Financial Analysis
Table: 149 KUKA AG: Products
Table: 150 KUKA AG: Financial Analysis
Table: 151 Motorola Solutions, Inc.: Products
Table: 152 Motorola Solutions, Inc.: Financial Analysis
Figure: 1 Executive Summary: Global & Asia Pacific Robotics Market, Value (US$ Bn) and Volume (‘000 Units) 2020-2033
Figure: 2 Adoption Analysis: Preferred, By Component
Figure: 3 Adoption Analysis: Global Robotics Market, By Revenue (US$ Bn), 2020-2033
Figure: 4 Adoption Analysis: Preferred, By Application
Figure: 5 Market Dynamics and Trends: Driver: Annual Installation of Industrial Robots, by Country (in 000’ Units)
Figure: 6 Covid -19 Impact & Recovery: Global Robotics Market Size (US$ Bn), Covid-19 Impact & Recovery, 2020-2033
Figure: 7 Competitive Dashboard: Market Share Analysis, By Company, Based on Revenue (2020)
Figure: 8 Global Robotics Market, By Component, CAGR (%), 2024-2033
Figure: 9 Global Robotics Market Share (%), By Component, 2020
Figure: 10 Global Robotics Market Share (%), By Component, 2033
Figure: 11 Global Robotics Market, By Robot Type, CAGR (%), 2024-2033
Figure: 12 Global Robotics Market Share (%), By Robot Type, 2020
Figure: 13 Global Robotics Market Share (%), By Robot Type, 2033
Figure: 14 Global Robotics Market, By Application, CAGR (%), 2024-2033
Figure: 15 Global Robotics Market Share (%), By Application, 2020
Figure: 16 Global Robotics Market Share (%), By Application, 2033
Figure: 17 Global Robotics Market, By Industry, CAGR (%), 2024-2033
Figure: 18 Global Robotics Market Share (%), By Industry, 2020
Figure: 19 Global Robotics Market Share (%), By Industry, 2033
Figure: 20 Global Robotics Market, By Region, CAGR (%), 2024-2033
Figure: 21 Global Robotics Market Share (%), By Region, 2020
Figure: 22 Global Robotics Market Share (%), By Region, 2033
Figure: 23 North America: Highest Share (%) Segment
Figure: 24 North America: Net Opportunity Addition – In US$ Bn
Figure: 25 North America: Impact Analysis - Chart
Figure: 26 North America: Opportunity Assessment, By Component
Figure: 27 North America: Opportunity Assessment, By Robot Type
Figure: 28 North America: Opportunity Assessment, By Application
Figure: 29 North America: Opportunity Assessment, By Industry
Figure: 30 North America Robotics Market Share (%), By Country, 2020
Figure: 31 North America Robotics Market Share (%), By Country, 2033
Figure: 32 North America Robotics Market Share (%), By Component, 2020
Figure: 33 North America Robotics Market Share (%), By Component, 2033
Figure: 34 North America Robotics Market Share (%), By Robot Type, 2020
Figure: 35 North America Robotics Market Share (%), By Robot Type, 2033
Figure: 36 North America Robotics Market Share (%), By Application, 2020
Figure: 37 North America Robotics Market Share (%), By Application, 2033
Figure: 38 North America Robotics Market Share (%), By Industry 2020
Figure: 39 North America Robotics Market Share (%), By Industry, 2033
Figure: 40 Europe: Highest Share (%) Segment
Figure: 41 Europe: Net Opportunity Addition – In US$ Bn
Figure: 42 Europe: Impact Analysis - Chart
Figure: 43 Europe: Opportunity Assessment, By Component
Figure: 44 Europe: Opportunity Assessment, By Robot Type
Figure: 45 Europe: Opportunity Assessment, By Application
Figure: 46 Europe: Opportunity Assessment, By Industry
Figure: 47 Europe Robotics Market Share (%), By Country, 2020
Figure: 48 Europe Robotics Market Share (%), By Country, 2033
Figure: 49 Europe Robotics Market Share (%), By Component, 2020
Figure: 50 Europe Robotics Market Share (%), By Component, 2033
Figure: 51 Europe Robotics Market Share (%), By Robot Type, 2020
Figure: 52 Europe Robotics Market Share (%), By Robot Type, 2033
Figure: 53 Europe Robotics Market Share (%), By Application, 2020
Figure: 54 Europe Robotics Market Share (%), By Application, 2033
Figure: 55 Europe Robotics Market Share (%), By Industry 2020
Figure: 56 Europe Robotics Market Share (%), By Industry, 2033
Figure: 57 Asia Pacific: Highest Share (%) Segment
Figure: 58 Asia Pacific: Net Opportunity Addition – In US$ Bn
Figure: 59 Asia Pacific: Impact Analysis - Chart
Figure: 60 Asia Pacific: Opportunity Assessment, By Component
Figure: 61 Asia Pacific: Opportunity Assessment, By Robot Type
Figure: 62 Asia Pacific: Opportunity Assessment, By Application
Figure: 63 Asia Pacific: Opportunity Assessment, By Industry
Figure: 64 Asia Pacific Robotics Market Share (%), By Country, 2020
Figure: 65 Asia Pacific Robotics Market Share (%), By Country, 2033
Figure: 66 Asia Pacific Robotics Market Share (%), By Component, 2020
Figure: 67 Asia Pacific Robotics Market Share (%), By Component, 2033
Figure: 68 Asia Pacific Robotics Market Share (%), By Robot Type, 2020
Figure: 69 Asia Pacific Robotics Market Share (%), By Robot Type, 2033
Figure: 70 Asia Pacific Robotics Market Share (%), By Application, 2020
Figure: 71 Asia Pacific Robotics Market Share (%), By Application, 2033
Figure: 72 Asia Pacific Robotics Market Share (%), By Industry 2020
Figure: 73 Asia Pacific Robotics Market Share (%), By Industry, 2033
Figure: 74 Middle East & Africa: Highest Share (%) Segment
Figure: 75 Middle East & Africa: Net Opportunity Addition – In US$ Bn
Figure: 76 Middle East & Africa: Impact Analysis - Chart
Figure: 77 Middle East & Africa: Opportunity Assessment, By Component
Figure: 78 Middle East & Africa: Opportunity Assessment, By Robot Type
Figure: 79 Middle East & Africa: Opportunity Assessment, By Application
Figure: 80 Middle East & Africa: Opportunity Assessment, By Industry
Figure: 81 Middle East & Africa Robotics Market Share (%), By Country, 2020
Figure: 82 Middle East & Africa Robotics Market Share (%), By Country, 2033
Figure: 83 Middle East & Africa Robotics Market Share (%), By Component, 2020
Figure: 84 Middle East & Africa Robotics Market Share (%), By Component, 2033
Figure: 85 Middle East & Africa Robotics Market Share (%), By Robot Type, 2020
Figure: 86 Middle East & Africa Robotics Market Share (%), By Robot Type, 2033
Figure: 87 Middle East & Africa Robotics Market Share (%), By Application, 2020
Figure: 88 Middle East & Africa Robotics Market Share (%), By Application, 2033
Figure: 89 Middle East & Africa Robotics Market Share (%), By Industry 2020
Figure: 90 Middle East & Africa Robotics Market Share (%), By Industry, 2033
Figure: 91 South America: Highest Share (%) Segment
Figure: 92 South America: Net Opportunity Addition – In US$ Bn
Figure: 93 South America: Impact Analysis - Chart
Figure: 94 South America: Opportunity Assessment, By Component
Figure: 95 South America: Opportunity Assessment, By Robot Type
Figure: 96 South America: Opportunity Assessment, By Application
Figure: 97 South America: Opportunity Assessment, By Industry
Figure: 98 South America Robotics Market Share (%), By Country, 2020
Figure: 99 South America Robotics Market Share (%), By Country, 2033
Figure: 100 South America Robotics Market Share (%), By Component, 2020
Figure: 101 South America Robotics Market Share (%), By Component, 2033
Figure: 102 South America Robotics Market Share (%), By Robot Type, 2020
Figure: 103 South America Robotics Market Share (%), By Robot Type, 2033
Figure: 104 South America Robotics Market Share (%), By Application, 2020
Figure: 105 South America Robotics Market Share (%), By Application, 2033
Figure: 106 South America Robotics Market Share (%), By Industry 2020
Figure: 107 South America Robotics Market Share (%), By Industry, 2033
Figure: 108 China: Highest Share (%) Segment
Figure: 109 China: Net Opportunity Addition – In US$ Bn
Figure: 110 China: Impact Analysis - Chart
Figure: 111 China: Opportunity Assessment, By Component
Figure: 112 China: Opportunity Assessment, By Robot Type
Figure: 113 China: Opportunity Assessment, By Application
Figure: 114 China: Opportunity Assessment, By Industry
Figure: 115 China Robotics Market Share (%), By Component, 2020
Figure: 116 China Robotics Market Share (%), By Component, 2033
Figure: 117 China Robotics Market Share (%), By Robot Type, 2020
Figure: 118 China Robotics Market Share (%), By Robot Type, 2033
Figure: 119 China Robotics Market Share (%), By Application, 2020
Figure: 120 China Robotics Market Share (%), By Application, 2033
Figure: 121 China Robotics Market Share (%), By Industry 2020
Figure: 122 China Robotics Market Share (%), By Industry, 2033
Figure: 123 India: Highest Share (%) Segment
Figure: 124 India: Net Opportunity Addition – In US$ Bn
Figure: 125 India: Impact Analysis - Chart
Figure: 126 India: Opportunity Assessment, By Component
Figure: 127 India: Opportunity Assessment, By Robot Type
Figure: 128 India: Opportunity Assessment, By Application
Figure: 129 India: Opportunity Assessment, By Industry
Figure: 130 India Robotics Market Share (%), By Component, 2020
Figure: 131 India Robotics Market Share (%), By Component, 2033
Figure: 132 India Robotics Market Share (%), By Robot Type, 2020
Figure: 133 India Robotics Market Share (%), By Robot Type, 2033
Figure: 134 India Robotics Market Share (%), By Application, 2020
Figure: 135 India Robotics Market Share (%), By Application, 2033
Figure: 136 India Robotics Market Share (%), By Industry 2020
Figure: 137 India Robotics Market Share (%), By Industry, 2033
Figure: 138 Japan: Highest Share (%) Segment
Figure: 139 Japan: Net Opportunity Addition – In US$ Bn
Figure: 140 Japan: Impact Analysis - Chart
Figure: 141 Japan: Opportunity Assessment, By Component
Figure: 142 Japan: Opportunity Assessment, By Robot Type
Figure: 143 Japan: Opportunity Assessment, By Application
Figure: 144 Japan: Opportunity Assessment, By Industry
Figure: 145 Japan Robotics Market Share (%), By Component, 2020
Figure: 146 Japan Robotics Market Share (%), By Component, 2033
Figure: 147 Japan Robotics Market Share (%), By Robot Type, 2020
Figure: 148 Japan Robotics Market Share (%), By Robot Type, 2033
Figure: 149 Japan Robotics Market Share (%), By Application, 2020
Figure: 150 Japan Robotics Market Share (%), By Application, 2033
Figure: 151 Japan Robotics Market Share (%), By Industry 2020
Figure: 152 Japan Robotics Market Share (%), By Industry, 2033
Figure: 153 ASEAN: Highest Share (%) Segment
Figure: 154 ASEAN: Net Opportunity Addition – In US$ Bn
Figure: 155 ASEAN: Impact Analysis - Chart
Figure: 156 ASEAN: Opportunity Assessment, By Component
Figure: 157 ASEAN: Opportunity Assessment, By Robot Type
Figure: 158 ASEAN: Opportunity Assessment, By Application
Figure: 159 ASEAN: Opportunity Assessment, By Industry
Figure: 160 ASEAN Robotics Market Share (%), By Component, 2020
Figure: 161 ASEAN Robotics Market Share (%), By Component, 2033
Figure: 162 ASEAN Robotics Market Share (%), By Robot Type, 2020
Figure: 163 ASEAN Robotics Market Share (%), By Robot Type, 2033
Figure: 164 ASEAN Robotics Market Share (%), By Application, 2020
Figure: 165 ASEAN Robotics Market Share (%), By Application, 2033
Figure: 166 ASEAN Robotics Market Share (%), By Industry 2020
Figure: 167 ASEAN Robotics Market Share (%), By Industry, 2033
Figure: 168 Singapore: Highest Share (%) Segment
Figure: 169 Singapore: Net Opportunity Addition – In US$ Bn
Figure: 170 Singapore: Impact Analysis - Chart
Figure: 171 Singapore: Opportunity Assessment, By Component
Figure: 172 Singapore: Opportunity Assessment, By Robot Type
Figure: 173 Singapore: Opportunity Assessment, By Application
Figure: 174 Singapore: Opportunity Assessment, By Industry
Figure: 175 Singapore Robotics Market Share (%), By Component, 2020
Figure: 176 Singapore Robotics Market Share (%), By Component, 2033
Figure: 177 Singapore Robotics Market Share (%), By Robot Type, 2020
Figure: 178 Singapore Robotics Market Share (%), By Robot Type, 2033
Figure: 179 Singapore Robotics Market Share (%), By Application, 2020
Figure: 180 Singapore Robotics Market Share (%), By Application, 2033
Figure: 181 Singapore Robotics Market Share (%), By Industry 2020
Figure: 182 Singapore Robotics Market Share (%), By Industry, 2033
Figure: 183 Indonesia: Highest Share (%) Segment
Figure: 184 Indonesia: Net Opportunity Addition – In US$ Bn
Figure: 185 Indonesia: Impact Analysis - Chart
Figure: 186 Indonesia: Opportunity Assessment, By Component
Figure: 187 Indonesia: Opportunity Assessment, By Robot Type
Figure: 188 Indonesia: Opportunity Assessment, By Application
Figure: 189 Indonesia: Opportunity Assessment, By Industry
Figure: 190 Indonesia Robotics Market Share (%), By Component, 2020
Figure: 191 Indonesia Robotics Market Share (%), By Component, 2033
Figure: 192 Indonesia Robotics Market Share (%), By Robot Type, 2020
Figure: 193 Indonesia Robotics Market Share (%), By Robot Type, 2033
Figure: 194 Indonesia Robotics Market Share (%), By Application, 2020
Figure: 195 Indonesia Robotics Market Share (%), By Application, 2033
Figure: 196 Indonesia Robotics Market Share (%), By Industry 2020
Figure: 197 Indonesia Robotics Market Share (%), By Industry, 2033
Figure: 198 South Korea: Highest Share (%) Segment
Figure: 199 South Korea: Net Opportunity Addition – In US$ Bn
Figure: 200 South Korea: Impact Analysis - Chart
Figure: 201 South Korea: Opportunity Assessment, By Component
Figure: 202 South Korea: Opportunity Assessment, By Robot Type
Figure: 203 South Korea: Opportunity Assessment, By Application
Figure: 204 South Korea: Opportunity Assessment, By Industry
Figure: 205 South Korea Robotics Market Share (%), By Component, 2020
Figure: 206 South Korea Robotics Market Share (%), By Component, 2033
Figure: 207 South Korea Robotics Market Share (%), By Robot Type, 2020
Figure: 208 South Korea Robotics Market Share (%), By Robot Type, 2033
Figure: 209 South Korea Robotics Market Share (%), By Application, 2020
Figure: 210 South Korea Robotics Market Share (%), By Application, 2033
Figure: 211 South Korea Robotics Market Share (%), By Industry 2020
Figure: 212 South Korea Robotics Market Share (%), By Industry, 2033
Figure: 213 ABB LTD: Business Revenue Segmentation, 2020
Figure: 214 ABB LTD: Geographical Revenue Segmentation, 2020
Figure: 215 DENSO: Business Revenue Segmentation, 2020
Figure: 216 DENSO: Geographical Revenue Segmentation, 2020
Figure: 217 Fanuc Corporation: Business Revenue Segmentation, 2020
Figure: 218 Fanuc Corporation: Geographical Revenue Segmentation, 2020
Figure: 219 Omron Corporation: Business Revenue Segmentation, 2020
Figure: 220 Omron Corporation: Geographical Revenue Segmentation, 2020
Figure: 221 Seiko Epson Corporation: Business Revenue Segmentation, 2020
Figure: 222 Seiko Epson Corporation:Geographical Revenue Segmentation, 2020
Figure: 223 Yaskawa Electric Corporation: Business Revenue Segmentation, 2020
Figure: 224 Yaskawa Electric Corporation: Geographical Revenue Segmentation, 2020
Figure: 225 Honeywell International Inc.: Business Revenue Segmentation, 2020
Figure: 226 Honeywell International Inc.: Geographical Revenue Segmentation, 2020
Figure: 227 Kawasaki Heavy Industries, Ltd.: Business Revenue Segmentation, 2020
Figure: 228 Kawasaki Heavy Industries, Ltd.: Geography Revenue Segmentation, 2020
Figure: 229 Mitsubishi Electric Corporation: Business Revenue Segmentation, 2020
Figure: 230 Mitsubishi Electric Corporation: Geography Revenue Segmentation, 2020
Figure: 231 KUKA AG: Business Revenue Segmentation, 2020
Figure: 232 KUKA AG: Geography Revenue Segmentation, 2020
Figure: 233 Motorola Solutions, Inc.: Business Revenue Segmentation, 2020
Figure: 234 Motorola Solutions, Inc.: Geography Revenue Segmentation, 2020


Choose License Type


Features | Type of License | ||||
Data Book | Single User |   Multi User | Corporate | ||
| e-Access | ✓ | ✓ | ✓ | ✓ | |
User Sharing | 1 User Only | 1 User Only | Up to 7 Users | Unlimited User Access | |
⨉ | ⨉ | ⨉ | ✓ | ||
Free Customization | No Free Customization | Up To 30 hrs work | Up To 60 hrs work | Up To 80 hrs work | |
Deliverable |
| ⨉ | ✓ | ✓ | ✓ |
| ✓ | ⨉ | ✓ | ✓ | |
| ⨉ | ⨉ | ⨉ | ✓ | |
Analyst Support | 2-Months Analyst Support | 4-Months Analyst Support | 7-Months Analyst Support | One Year Analyst Support | |
Free Report update in next update cycle | ⨉ | ⨉ | ⨉ | ✓ | |
Free Industry Update (Within 180 days) | ⨉ | ⨉ | ⨉ | ✓ | |
Benefit | Up to 10% off on Post Purchase | Up to 20% off on Post Purchase | Up to 30% off on Post Purchase | Up to 40% off on Post Purchase | |