Pea Protein Ingredients Market: By Type (Pea Protein Isolates, Pea Protein Concentrates, Textured Pea Protein, Pea Protein Hydrolysate, and Others); Source (Yellow Pea and Green Pea); Form (Dry and Liquid); Application (Nutrition and Health Supplements, Alternative Meat Products, Bakery & Confectionery Products, and Others); and Region—Industry Dynamics, Market Size, Opportunity and Forecast for 2025–2033
- Last Updated: Jan-2025 | Format:
![pdf]()
![powerpoint]()
![excel]() | Report ID: AA0622259 | Delivery: 2 to 4 Hours
| Report ID: AA0622259 | Delivery: 2 to 4 Hours


 | Report ID: AA0622259 | Delivery: 2 to 4 Hours
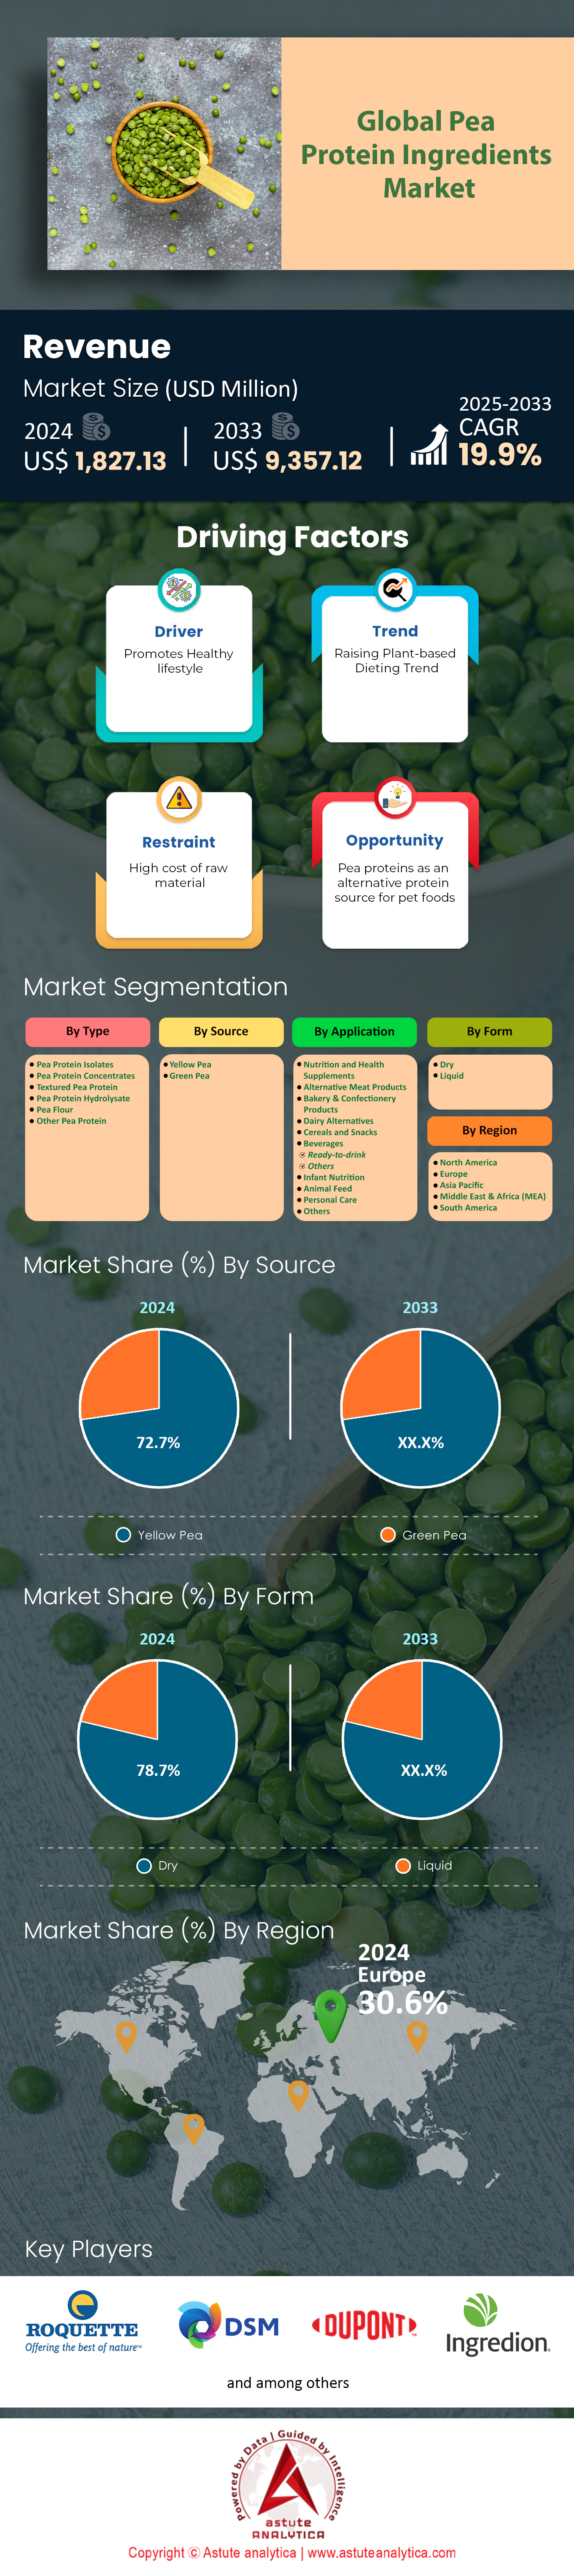
 Table:1 Industry Outlook: Patents that use Pea as preferable raw material
Table:2 Industry Outlook: Nutrient Content of Pea Protein-based Products
Table:3 Industry Outlook: Pea Protein Vs Whey Protein
Table:4 Industry Outlook: Average Pea Production of major producing countries
Table:5 Market Dynamics and Trends: Impact Analysis of Market Dynamics
Table:6 Regulatory landscape: Regulations for Pea Protein
Table:7 Competitive Dashboard: Competitor Mapping & Benchmarking
Table:8 Global Pea Protein Ingredients Market Size (US$ Mn), By Type, 2020-2033
Table:9 Global Pea Protein Ingredients Market Size (MT), By Type, 2020-2033
Table:10 Global Pea Protein Ingredients Market Size (US$ Mn), By Source, 2020-2033
Table:11 Global Pea Protein Ingredients Market Size (MT), By Source, 2020-2033
Table:12 Global Pea Protein Ingredients Market Size (US$ Mn), By Form, 2020-2033
Table:13 Global Pea Protein Ingredients Market Size (MT), By Form, 2020-2033
Table:14 Global Pea Protein Ingredients Market Size (US$ Mn), By Application, 2020-2033
Table:15 Global Pea Protein Ingredients Market Size (MT), By Application, 2020-2033
Table:16 Global Pea Protein Ingredients Market Size (US$ Mn), By Application - Nutrition and Health Supplements, 2020-2033
Table:17 Global Pea Protein Ingredients Market Size (MT), By Application - Nutrition and Health Supplements, 2020-2033
Table:18 Global Pea Protein Ingredients Market Size (US$ Mn), By Application - Alternative Meat Products, 2020-2033
Table:19 Global Pea Protein Ingredients Market Size (MT), By Application - Alternative Meat Products, 2020-2033
Table:20 Global Pea Protein Ingredients Market Size (US$ Mn), By Application - Bakery & Confectionery Products, 2020-2033
Table:21 Global Pea Protein Ingredients Market Size (MT), By Application - Bakery & Confectionery Products, 2020-2033
Table:22 Global Pea Protein Ingredients Market Size (US$ Mn), By Application - Dairy Alternatives, 2020-2033
Table:23 Global Pea Protein Ingredients Market Size (MT), By Application - Dairy Alternatives, 2020-2033
Table:24 Global Pea Protein Ingredients Market Size (US$ Mn), By Application - Cereals and Snacks, 2020-2033
Table:25 Global Pea Protein Ingredients Market Size (MT), By Application - Cereals and Snacks, 2020-2033
Table:26 Global Pea Protein Ingredients Market Size (US$ Mn), By Application - Beverages, 2020-2033
Table:27 Global Pea Protein Ingredients Market Size (MT), By Application - Beverages, 2020-2033
Table:28 Global Pea Protein Ingredients Market Size (US$ Mn), By Application - Infant Nutrition, 2020-2033
Table:29 Global Pea Protein Ingredients Market Size (US$ Mn), By Application - Infant Nutrition, 2020-2033
Table:30 Global Pea Protein Ingredients Market Size (US$ Mn), By Application - Animal Feed, 2020-2033
Table:31 Global Pea Protein Ingredients Market Size (MT), By Application - Animal Feed, 2020-2033
Table:32 Global Pea Protein Ingredients Market Size (US$ Mn), By Application - Personal Care, 2020-2033
Table:33 Global Pea Protein Ingredients Market Size (US$ Mn), By Application - Personal Care, 2020-2033
Table:34 Global Pea Protein Ingredients Market Size (US$ Mn), By Region, 2020-2033
Table:35 Global Pea Protein Ingredients Market Size (MT), By Region, 2020-2033
Table:36 North America Pea Protein Ingredients Market Size (US$ Mn), By Country, 2020-2033
Table:37 North America Pea Protein Ingredients Market Size (MT), By Country, 2020-2033
Table:38 North America Pea Protein Ingredients Market Size (US$ Mn), By Type, 2020-2033
Table:39 North America Pea Protein Ingredients Market Size (MT), By Type, 2020-2033
Table:40 North America Pea Protein Ingredients Market Size (US$ Mn), By Source, 2020-2033
Table:41 North America Pea Protein Ingredients Market Size (MT), By Source, 2020-2033
Table:42 North America Pea Protein Ingredients Market Size (US$ Mn), By Form, 2020-2033
Table:43 North America Pea Protein Ingredients Market Size (MT), By Form, 2020-2033
Table:44 North America Pea Protein Ingredients Market Size (US$ Mn), By Application, 2020-2033
Table:45 North America Pea Protein Ingredients Market Size (MT), By Application, 2020-2033
Table:46 Europe Pea Protein Ingredients Market Size (US$ Mn), By Country, 2020-2033
Table:47 Europe Pea Protein Ingredients Market Size (MT), By Country, 2020-2033
Table:48 Europe Pea Protein Ingredients Market Size (US$ Mn), By Type, 2020-2033
Table:49 Europe Pea Protein Ingredients Market Size (MT), By Type, 2020-2033
Table:50 Europe Pea Protein Ingredients Market Size (US$ Mn), By Source, 2020-2033
Table:51 Europe Pea Protein Ingredients Market Size (MT), By Source, 2020-2033
Table:52 Europe Pea Protein Ingredients Market Size (US$ Mn), By Form, 2020-2033
Table:53 Europe Pea Protein Ingredients Market Size (MT), By Form, 2020-2033
Table:54 Europe Pea Protein Ingredients Market Size (US$ Mn), By Application, 2020-2033
Table:55 Europe Pea Protein Ingredients Market Size (MT), By Application, 2020-2033
Table:56 Asia Pacific Pea Protein Ingredients Market Size (US$ Mn), By Country, 2020-2033
Table:57 Asia Pacific Pea Protein Ingredients Market Size (MT), By Country, 2020-2033
Table:58 Asia Pacific Pea Protein Ingredients Market Size (US$ Mn), By Type, 2020-2033
Table:59 Asia Pacific Pea Protein Ingredients Market Size (MT), By Type, 2020-2033
Table:60 Asia Pacific Pea Protein Ingredients Market Size (US$ Mn), By Source, 2020-2033
Table:61 Asia Pacific Pea Protein Ingredients Market Size (MT), By Source, 2020-2033
Table:62 Asia Pacific Pea Protein Ingredients Market Size (US$ Mn), By Form, 2020-2033
Table:63 Asia Pacific Pea Protein Ingredients Market Size (MT), By Form, 2020-2033
Table:64 Asia Pacific Pea Protein Ingredients Market Size (US$ Mn), By Application, 2020-2033
Table:65 Asia Pacific Pea Protein Ingredients Market Size (MT), By Application, 2020-2033
Table:66 Middle East & Africa Pea Protein Ingredients Market Size (US$ Mn), By Country, 2020-2033
Table:67 Middle East & Africa Pea Protein Ingredients Market Size (MT), By Country, 2020-2033
Table:68 Middle East & Africa Pea Protein Ingredients Market Size (US$ Mn), By Type, 2020-2033
Table:69 Middle East & Africa Pea Protein Ingredients Market Size (MT), By Type, 2020-2033
Table:70 Middle East & Africa Pea Protein Ingredients Market Size (US$ Mn), By Source, 2020-2033
Table:71 Middle East & Africa Pea Protein Ingredients Market Size (MT), By Source, 2020-2033
Table:72 Middle East & Africa Pea Protein Ingredients Market Size (US$ Mn), By Form, 2020-2033
Table:73 Middle East & Africa Pea Protein Ingredients Market Size (MT), By Form, 2020-2033
Table:74 Middle East & Africa Pea Protein Ingredients Market Size (US$ Mn), By Application, 2020-2033
Table:75 Middle East & Africa Pea Protein Ingredients Market Size (MT), By Application, 2020-2033
Table:76 South America Pea Protein Ingredients Market Size (US$ Mn), By Country, 2020-2033
Table:77 South America Pea Protein Ingredients Market Size (MT), By Country, 2020-2033
Table:78 South America Pea Protein Ingredients Market Size (US$ Mn), By Type, 2020-2033
Table:79 South America Pea Protein Ingredients Market Size (MT), By Type, 2020-2033
Table:80 South America Pea Protein Ingredients Market Size (US$ Mn), By Source, 2020-2033
Table:81 South America Pea Protein Ingredients Market Size (MT), By Source, 2020-2033
Table:82 South America Pea Protein Ingredients Market Size (US$ Mn), By Form, 2020-2033
Table:83 South America Pea Protein Ingredients Market Size (MT), By Form, 2020-2033
Table:84 South America Pea Protein Ingredients Market Size (US$ Mn), By Application, 2020-2033
Table:85 South America Pea Protein Ingredients Market Size (MT), By Application, 2020-2033
Table:86 DuPont de Nemours, Inc.: Products
Table:87 DuPont de Nemours, Inc.: Manufacturing Site
Table:88 DuPont de Nemours, Inc.: Financial Analysis
Table:89 Cargill, Incorporated: Recent Developments
Table:90 Cargill, Incorporated: Products
Table:91 Cargill, Incorporated: Manufacturing Site
Table:92 A&B Ingredients, Inc.: Products
Table:93 AGT Food and Ingredients Inc.: Recent Developments
Table:94 AGT Food and Ingredients Inc.: Products
Table:95 AGT Food and Ingredients Inc.: Proximate analysis of PulsePlus Protein
Table:96 AGT Food and Ingredients Inc.: Manufacturing Site
Table:97 Archer-Daniels-Midland Company: Recent Developments
Table:98 Archer-Daniels-Midland Company: Products
Table:99 Archer-Daniels-Midland Company: Manufacturing Site
Table:100 Archer-Daniels-Midland Company: Financial Analysis
Table:101 Axiom Foods Inc.: Recent Developments
Table:102 Axiom Foods Inc.: Products
Table:103 Burcon NutraScience Corporation: Recent Developments
Table:104 Burcon NutraScience Corporation: Products
Table:105 Burcon NutraScience Corporation: Manufacturing Site
Table:106 Cosucra Groupe Warcoing SA: Recent Developments
Table:107 Cosucra Groupe Warcoing SA: Products
Table:108 Cosucra Groupe Warcoing SA: Manufacturing Site
Table:109 Emsland Group: Recent Developments
Table:110 Emsland Group: Products
Table:111 Farbest Brands: Recent Developments
Table:112 Farbest Brands: Products
Table:113 FENCHEM: Products
Table:114 FENCHEM: Manufacturing Site
Table:115 Glanbia plc: Products
Table:116 Glanbia plc: Financial Analysis
Table:117 Ingredion Incorporated: Recent Developments
Table:118 Ingredion Incorporated: Products
Table:119 Ingredion Incorporated: Manufacturing Site
Table:120 Ingredion Incorporated: Financial Analysis
Table:121 Nutri-Pea: Products
Table:122 PURIS: Recent Developments
Table:123 PURIS: Products
Table:124 PURIS: Manufacturing Site
Table:125 Roquette Frères: Recent Developments
Table:126 Roquette Frères: Products
Table:127 Roquette Frères: Manufacturing Site
Table:128 Shandong Jianyuan group: Products
Table:129 The Green Labs LLC.: Products
Table:130 Other Prominent Players
Figure: 1 Global Pea Protein Ingredients Market, 2020-2033 (US$ Million)
Figure: 2 Global Pea Protein Ingredients Market, 2020-2033 (000’ Metric Ton)
Figure: 3 Adoption Analysis: Preferred, By Pea Protein Type
Figure: 4 Adoption Analysis: Global Pea Protein Ingredients Market, Y-o-Y (%), 2020-2033
Figure: 5 Adoption Analysis: Revenue Comparison (2020, 2025, 2033), By Form (US$ Mn)
Figure: 6 Market Dynamics and Trends – Driver (Demand Side): Plant-based meat and seafood dollar sales, U.S. retail, 2018-2024
Figure: 7 Covid-19 Impact & Recovery: Global Pea Protein Ingredients Market, Covid-19 Impact & Recovery, 2019-2033, Y-o-Y (%)
Figure: 8 Product Price Analysis: Price Analysis, By Type (Average Pricing, in US $/ Tons)
Figure: 9 Competitive Dashboard: Market Share Analysis, By Company, Based on Revenue (2024)
Figure: 10 Global Pea Protein Ingredients Market, By Type, CAGR (%), 2024-2033
Figure: 11 Global Pea Protein Ingredients Market Share (%), By Type, 2024
Figure: 12 Global Pea Protein Ingredients Market Share (%), By Type, 2033
Figure: 13 Global Pea Protein Ingredients Market, By Source, CAGR (%), 2024-2033
Figure: 14 Global Pea Protein Ingredients Market Share (%), By Source, 2024
Figure: 15 Global Pea Protein Ingredients Market Share (%), By Source, 2033
Figure: 16 Global Pea Protein Ingredients Market, By Form, CAGR (%), 2024-2033
Figure: 17 Global Pea Protein Ingredients Market Share (%), By Form, 2024
Figure: 18 Global Pea Protein Ingredients Market Share (%), By Form, 2033
Figure: 19 Global Pea Protein Ingredients Market, By Application, CAGR (%), 2024-2033
Figure: 20 Global Pea Protein Ingredients Market Share (%), By Application, 2024
Figure: 21 Global Pea Protein Ingredients Market Share (%), By Application, 2033
Figure: 22 Global Pea Protein Ingredients Market, By Region, CAGR (%), 2024-2033
Figure: 23 Global Pea Protein Ingredients Market Share (%), By Region, 2024
Figure: 24 Global Pea Protein Ingredients Market Share (%), By Region, 2033
Figure: 25 North America: Highest Share (%) Segment
Figure: 26 North America: Net Opportunity Addition, in US$ Mn
Figure: 27 North America: Impact Analysis - Chart
Figure: 28 North America: Opportunity Assessment, By Type
Figure: 29 North America: Opportunity Assessment, By Source
Figure: 30 North America: Opportunity Assessment, By Form
Figure: 31 North America: Opportunity Assessment, By Application
Figure: 32 North America Pea Protein Ingredients Market, By Country, CAGR (%), 2024-2033
Figure: 33 North America Pea Protein Ingredients Market Share (%), By Country, 2024
Figure: 34 North America Pea Protein Ingredients Market Share (%), By Country, 2033
Figure: 35 North America Pea Protein Ingredients Market Share (%), By Type, 2024
Figure: 36 North America Pea Protein Ingredients Market Share (%), By Type, 2033
Figure: 37 North America Pea Protein Ingredients Market Share (%), By Source, 2024
Figure: 38 North America Pea Protein Ingredients Market Share (%), By Source, 2033
Figure: 39 North America Pea Protein Ingredients Market Share (%), By Form, 2024
Figure: 40 North America Pea Protein Ingredients Market Share (%), By Form, 2033
Figure: 41 North America Pea Protein Ingredients Market Share (%), By Application, 2024
Figure: 42 North America Pea Protein Ingredients Market Share (%), By Application, 2033
Figure: 43 Europe: Impact Analysis - Chart
Figure: 44 Europe: Opportunity Assessment, By Type
Figure: 45 Europe: Opportunity Assessment, By Source
Figure: 46 Europe: Opportunity Assessment, By Form
Figure: 47 Europe: Opportunity Assessment, By Application
Figure: 48 Europe Pea Protein Ingredients Market, By Country, CAGR (%), 2024-2033
Figure: 49 Europe Pea Protein Ingredients Market Share (%), By Country, 2024
Figure: 50 Europe Pea Protein Ingredients Market Share (%), By Country, 2033
Figure: 51 Europe Pea Protein Ingredients Market Share (%), By Type, 2024
Figure: 52 Europe Pea Protein Ingredients Market Share (%), By Type, 2033
Figure: 53 Europe Pea Protein Ingredients Market Share (%), By Source, 2024
Figure: 54 Europe Pea Protein Ingredients Market Share (%), By Source, 2033
Figure: 55 Europe Pea Protein Ingredients Market Share (%), By Form, 2024
Figure: 56 Europe Pea Protein Ingredients Market Share (%), By Form, 2033
Figure: 57 Europe Pea Protein Ingredients Market Share (%), By Application, 2024
Figure: 58 Europe Pea Protein Ingredients Market Share (%), By Application, 2033
Figure: 59 Asia Pacific: Impact Analysis - Chart
Figure: 60 Asia Pacific: Opportunity Assessment, By Type
Figure: 61 Asia Pacific: Opportunity Assessment, By Source
Figure: 62 Asia Pacific: Opportunity Assessment, By Form
Figure: 63 Asia Pacific: Opportunity Assessment, By Application
Figure: 64 Asia Pacific Pea Protein Ingredients Market, By Country, CAGR (%), 2024-2033
Figure: 65 Asia Pacific Pea Protein Ingredients Market Share (%), By Country, 2024
Figure: 66 Asia Pacific Pea Protein Ingredients Market Share (%), By Country, 2033
Figure: 67 Asia Pacific Pea Protein Ingredients Market Share (%), By Type, 2024
Figure: 68 Asia Pacific Pea Protein Ingredients Market Share (%), By Type, 2033
Figure: 69 Asia Pacific Pea Protein Ingredients Market Share (%), By Source, 2024
Figure: 70 Asia Pacific Pea Protein Ingredients Market Share (%), By Source, 2033
Figure: 71 Asia Pacific Pea Protein Ingredients Market Share (%), By Form, 2024
Figure: 72 Asia Pacific Pea Protein Ingredients Market Share (%), By Form, 2033
Figure: 73 Asia Pacific Pea Protein Ingredients Market Share (%), By Application, 2024
Figure: 74 Asia Pacific Pea Protein Ingredients Market Share (%), By Application, 2033
Figure: 75 Middle East & Africa: Impact Analysis - Chart
Figure: 76 Middle East & Africa: Opportunity Assessment, By Type
Figure: 77 Middle East & Africa: Opportunity Assessment, By Source
Figure: 78 Middle East & Africa: Opportunity Assessment, By Form
Figure: 79 Middle East & Africa: Opportunity Assessment, By Application
Figure: 80 Middle East & Africa Pea Protein Ingredients Market, By Country, CAGR (%), 2024-2033
Figure: 81 Middle East & Africa Pea Protein Ingredients Market Share (%), By Country, 2024
Figure: 82 Middle East & Africa Pea Protein Ingredients Market Share (%), By Country, 2033
Figure: 83 Middle East & Africa Pea Protein Ingredients Market Share (%), By Type, 2024
Figure: 84 Middle East & Africa Pea Protein Ingredients Market Share (%), By Type, 2033
Figure: 85 Middle East & Africa Pea Protein Ingredients Market Share (%), By Source, 2024
Figure: 86 Middle East & Africa Pea Protein Ingredients Market Share (%), By Source, 2033
Figure: 87 Middle East & Africa Pea Protein Ingredients Market Share (%), By Form, 2024
Figure: 88 Middle East & Africa Pea Protein Ingredients Market Share (%), By Form, 2033
Figure: 89 Middle East & Africa Pea Protein Ingredients Market Share (%), By Application, 2024
Figure: 90 Middle East & Africa Pea Protein Ingredients Market Share (%), By Application, 2033
Figure: 91 South America: Impact Analysis - Chart
Figure: 92 South America: Opportunity Assessment, By Type
Figure: 93 South America: Opportunity Assessment, By Source
Figure: 94 South America: Opportunity Assessment, By Form
Figure: 95 South America: Opportunity Assessment, By Application
Figure: 96 South America Pea Protein Ingredients Market, By Country, CAGR (%), 2024-2033
Figure: 97 South America Pea Protein Ingredients Market Share (%), By Country, 2024
Figure: 98 South America Pea Protein Ingredients Market Share (%), By Country, 2033
Figure: 99 South America Pea Protein Ingredients Market Share (%), By Type, 2024
Figure: 100 South America Pea Protein Ingredients Market Share (%), By Type, 2033
Figure: 101 South America Pea Protein Ingredients Market Share (%), By Source, 2024
Figure: 102 South America Pea Protein Ingredients Market Share (%), By Source, 2033
Figure: 103 South America Pea Protein Ingredients Market Share (%), By Form, 2024
Figure: 104 South America Pea Protein Ingredients Market Share (%), By Form, 2033
Figure: 105 South America Pea Protein Ingredients Market Share (%), By Application, 2024
Figure: 106 South America Pea Protein Ingredients Market Share (%), By Application, 2033
Figure: 107 DuPont de Nemours, Inc.: Business Revenue Segmentation, 2024
Figure: 108 DuPont de Nemours, Inc.: Geographical Revenue Segmentation, 2024
Figure: 109 Archer-Daniels-Midland Company: Business Revenue Segmentation, 2024
Figure: 110 Archer-Daniels-Midland Company: Geographical Revenue Segmentation, 2024
Figure: 111 Glanbia plc: Business Revenue Segmentation, 2024
Figure: 112 Glanbia plc: Geographical Revenue Segmentation, 2024
Figure: 113 Ingredion Incorporated: Business Revenue Segmentation, 2024
Figure: 114 Ingredion Incorporated: Geographical Revenue Segmentation, 2024


Choose License Type


Features | Type of License | ||||
Data Book | Single User |   Multi User | Corporate | ||
| e-Access | ✓ | ✓ | ✓ | ✓ | |
User Sharing | 1 User Only | 1 User Only | Up to 7 Users | Unlimited User Access | |
⨉ | ⨉ | ⨉ | ✓ | ||
Free Customization | No Free Customization | Up To 30 hrs work | Up To 60 hrs work | Up To 80 hrs work | |
Deliverable |
| ⨉ | ✓ | ✓ | ✓ |
| ✓ | ⨉ | ✓ | ✓ | |
| ⨉ | ⨉ | ⨉ | ✓ | |
Analyst Support | 2-Months Analyst Support | 4-Months Analyst Support | 7-Months Analyst Support | One Year Analyst Support | |
Free Report update in next update cycle | ⨉ | ⨉ | ⨉ | ✓ | |
Free Industry Update (Within 180 days) | ⨉ | ⨉ | ⨉ | ✓ | |
Benefit | Up to 10% off on Post Purchase | Up to 20% off on Post Purchase | Up to 30% off on Post Purchase | Up to 40% off on Post Purchase | |