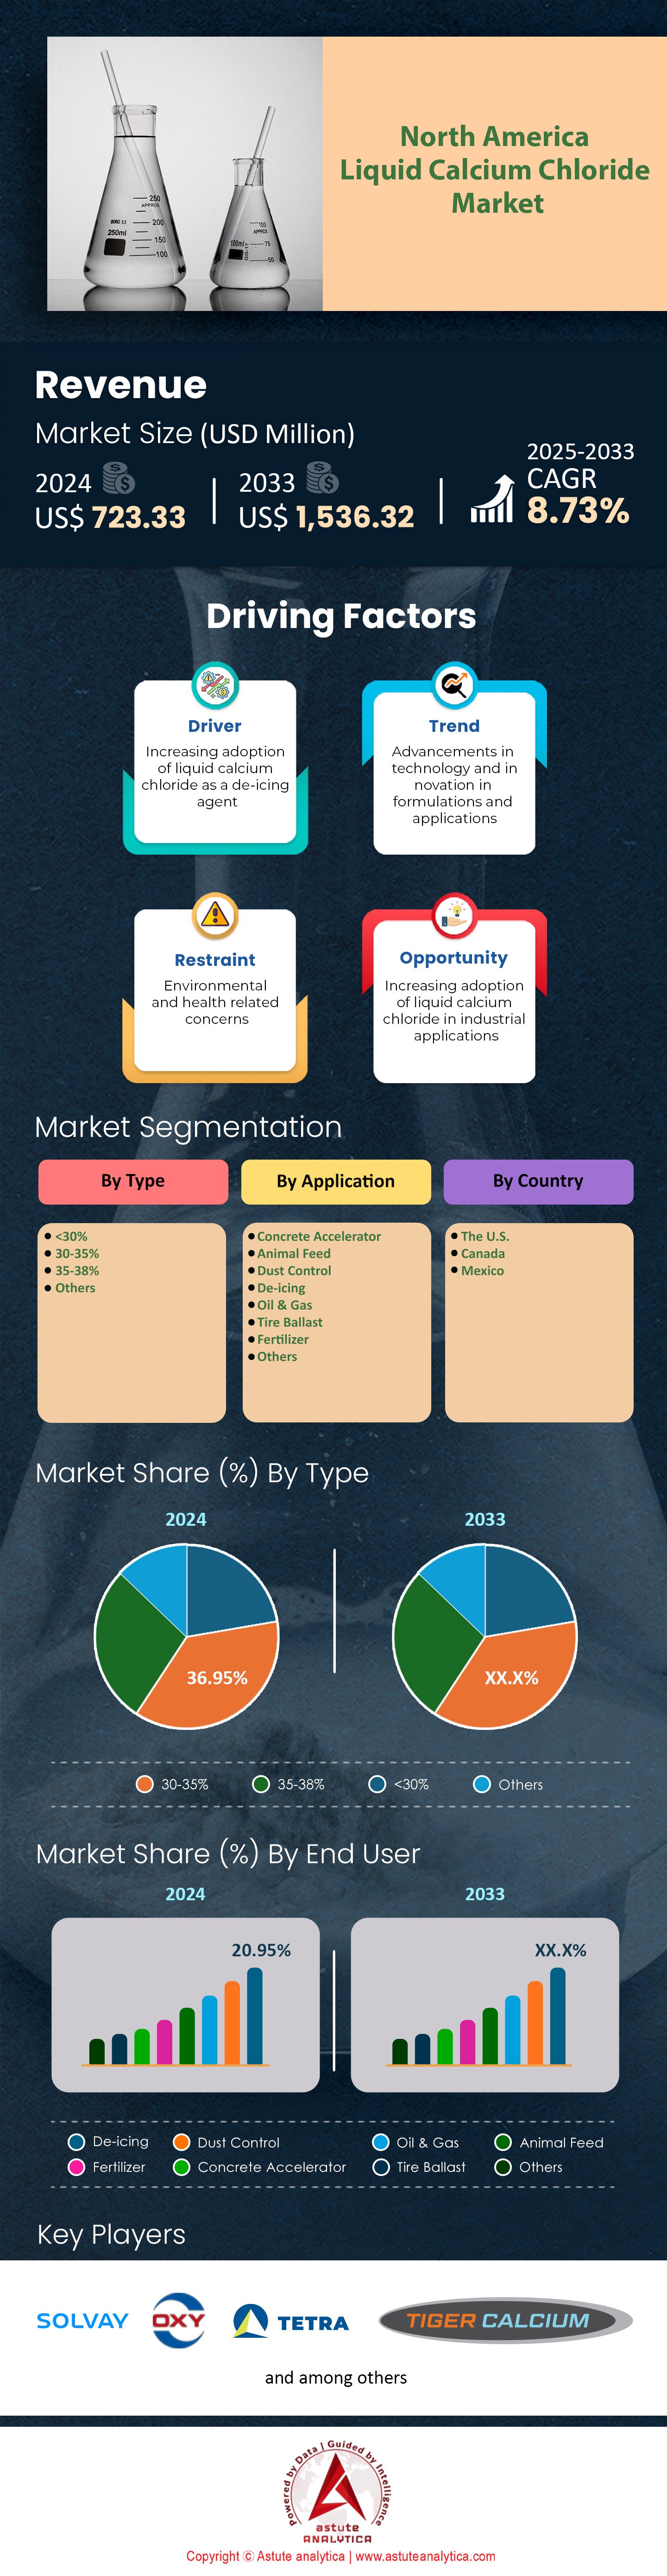
North America Liquid Calcium Chloride Market: By Type (<30%, 30-35%, 35-38% and Others); Application (Concrete Accelerator, Animal Feed, Dust Control, De-icing, Oil & Gas, Tire Ballast, Fertilizer and Others); Country—Industry Dynamics, Market Size and Opportunity Forecast for 2025–2033
- Last Updated: Feb-2025 | Format:
![pdf]()
![powerpoint]()
![excel]() | Report ID: AA0422209 | Delivery: 2 to 4 Hours
| Report ID: AA0422209 | Delivery: 2 to 4 Hours


 | Report ID: AA0422209 | Delivery: 2 to 4 Hours
 Table: 1 Industry Outlook : Exporters Of Calcium Chloride (2020)
Table: 2 Industry Outlook : Importers Of Calcium Chloride (2020)
Table: 3 Driver : Snowiest States In The Us, 2022
Table: 4 Market Dynamics And Trends : Impact Analysis Of Market Dynamics
Table: 5 Competitive Dashboard : Competitor Mapping & Benchmarking
Table: 6 North America Liquid Calcium Chloride Market Size (Us$ Mn), By Type, 2020-2033
Table: 7 North America Liquid Calcium Chloride Market Size (000' Liter), By Type, 2020-2033
Table: 8 North America Liquid Calcium Chloride Market Size (Us$ Mn), By Application, 2020-2033
Table: 9 North America Liquid Calcium Chloride Market Size (000' Liter), By Application, 2020-2033
Table: 10 North America Liquid Calcium Chloride Market Size (Us$ Mn), By Country, 2020-2033
Table: 11 North America Liquid Calcium Chloride Market Size (000' Liter), By Country, 2020-2033
Table: 12 The U.S. Liquid Calcium Chloride Market Size (Us$ Mn), By Type, 2020-2033
Table: 13 The U.S. Liquid Calcium Chloride Market Size (000' Liter), By Type, 2020-2033
Table: 14 The U.S. Liquid Calcium Chloride Market Size (Us$ Mn), By Application, 2020-2033
Table: 15 The U.S. Liquid Calcium Chloride Market Size (000' Liter), By Application, 2020-2033
Table: 16 Canada Liquid Calcium Chloride Market Size (Us$ Mn), By Type, 2020-2033
Table: 17 Canada Liquid Calcium Chloride Market Size (000' Liter), By Type, 2020-2033
Table: 18 Canada Liquid Calcium Chloride Market Size (Us$ Mn), By Application, 2020-2033
Table: 19 Canada Liquid Calcium Chloride Market Size (000' Liter), By Application, 2020-2033
Table: 20 Mexico Liquid Calcium Chloride Market Size (Us$ Mn), By Type, 2020-2033
Table: 21 Mexico Liquid Calcium Chloride Market Size (000' Liter), By Type, 2020-2033
Table: 22 Mexico Liquid Calcium Chloride Market Size (Us$ Mn), By Application, 2020-2033
Table: 23 Mexico Liquid Calcium Chloride Market Size (000' Liter), By Application, 2020-2033
Table: 24 Hill Brothers Chemical Co.: Products
Table: 25 Nedmag B.V.: Recent Developments
Table: 26 Nedmag B.V.: Products
Table: 27 Occidental Chemical Corporation : Recent Developments
Table: 28 Occidental Chemical Corporation : Products
Table: 29 Occidental Chemical Corporation : Financial Analysis
Table: 30 Solvay : Recent Developments
Table: 31 Solvay : Products
Table: 32 Solvay: Financial Analysis
Table: 33 Tetra Technologies, Inc. : Products
Table: 34 Tetra Technologies, Inc.: Financial Analysis
Table: 35 Tiger Calcium : Products
Table: 36 Ward Chemical Ltd.: Products
Table: 37 Shandong Haihua Alkali Baking Soda Industry Co., Ltd.: Products
Table: 38 Zirax Limited : Recent Developments
Table: 39 Zirax Limited : Products
Table: 40 Continental Chemical Usa : Products
Table: 41 Canada Salt Group Ltd : Products
Table: 42 Shaw Resources : Products
Table: 43 Coalescentrum Inc. : Products
Table: 44 Kortech Calcium Services Ltd.: Products
Table: 45 Univar Solutions Inc.: Products
Table: 46 Univar Solutions Inc.: Financial Analysis
Table: 47 Sicalco Ltd.: Products
Table: 48 Other Prominent Players
Figure: 1 Executive Summary : North America Liquid Calcium Chloride Market, Value (US$ Mn), 2020 - 2033
Figure: 2 Executive Summary : North America Liquid Calcium Chloride Market, Volume (000’ Liter), 2020 - 2033
Figure: 3 Driver : Total Construction Spending: Residential In The United States, 2012-2021
Figure: 4 Opportunity : US Crude Oil Production, 2000 To 2020, Million Barrels Per Day (B/D)
Figure: 5 Covid -19 Impact & Recovery: North America Liquid Calcium Chloride Market, Covid-19 Impact & Recovery, By Yoy (%), 2019-2033
Figure: 6 Product Pricing, By Product Type, US$
Figure: 7 Competitive Dashboard : Market Share Analysis, By Company, Based On Revenue (2024)
Figure: 8 North America Liquid Calcium Chloride Market, By Type, CAGR (%), 2024-2033
Figure: 9 North America Liquid Calcium Chloride Market Share (%), By Type, 2024
Figure: 10 North America Liquid Calcium Chloride Market Share (%), By Type, 2033
Figure: 11 North America Liquid Calcium Chloride Market, By Application, CAGR (%), 2024-2033
Figure: 12 North America Liquid Calcium Chloride Market Share (%), By Application, 2024
Figure: 13 North America Liquid Calcium Chloride Market Share (%), By Application, 2033
Figure: 14 North America Liquid Calcium Chloride Market, By Country, CAGR (%), 2024-2033
Figure: 15 North America Liquid Calcium Chloride Market Share (%), By Country, 2024
Figure: 16 North America Liquid Calcium Chloride Market Share (%), By Country, 2033
Figure: 17 The U.S.: Highest Share (%) Segment
Figure: 18 The U.S: Net Opportunity Addition, In US$ Mn
Figure: 19 The U.S.: Impact Analysis - Chart
Figure: 20 The U.S.: Opportunity Assessment, By Type
Figure: 21 The U.S.: Opportunity Assessment, By Application
Figure: 22 The U.S. Liquid Calcium Chloride Market Share (%), By Type, 2024
Figure: 23 The U.S. Liquid Calcium Chloride Market Share (%), By Type, 2033
Figure: 24 The U.S. Liquid Calcium Chloride Market Share (%), By Application, 2024
Figure: 25 The U.S. Liquid Calcium Chloride Market Share (%), By Application, 2033
Figure: 26 Canada: Highest Share (%) Segment
Figure: 27 Canada: Net Opportunity Addition, In US$ Mn
Figure: 28 Canada: Impact Analysis - Chart
Figure: 29 Canada: Opportunity Assessment, By Type
Figure: 30 Canada: Opportunity Assessment, By Application
Figure: 31 Canada Liquid Calcium Chloride Market Share (%), By Type, 2024
Figure: 32 Canada Liquid Calcium Chloride Market Share (%), By Type, 2033
Figure: 33 Canada Liquid Calcium Chloride Market Share (%), By Application, 2024
Figure: 34 Canada Liquid Calcium Chloride Market Share (%), By Application, 2033
Figure: 35 Mexico: Highest Share (%) Segment
Figure: 36 Mexico: Net Opportunity Addition, In US$ Mn
Figure: 37 Mexico: Impact Analysis - Chart
Figure: 38 Mexico: Opportunity Assessment, By Type
Figure: 39 Mexico: Opportunity Assessment, By Application
Figure: 40 Mexico Liquid Calcium Chloride Market Share (%), By Type, 2024
Figure: 41 Mexico Liquid Calcium Chloride Market Share (%), By Type, 2033
Figure: 42 Mexico Liquid Calcium Chloride Market Share (%), By Application, 2024
Figure: 43 Mexico Liquid Calcium Chloride Market Share (%), By Application, 2033
Figure: 44 Occidental Chemical Corporation: Business Revenue Segmentation, 2024
Figure: 45 Occidental Chemical Corporation: Geographical Revenue Segmentation, 2024
Figure: 46 Solvay: Business Revenue Segmentation, 2024
Figure: 47 Solvay: Geographical Revenue Segmentation, 2024
Figure: 48 TETRA Technologies, Inc.: Business Revenue Segmentation, 2024
Figure: 49 TETRA Technologies, Inc.: Geographical Revenue Segmentation, 2024
Figure: 50 Univar Solutions Inc.: Geographical Revenue Segmentation, 2024


Choose License Type


Features | Type of License | ||||
Data Book | Single User |   Multi User | Corporate | ||
| e-Access | ✓ | ✓ | ✓ | ✓ | |
User Sharing | 1 User Only | 1 User Only | Up to 7 Users | Unlimited User Access | |
⨉ | ⨉ | ⨉ | ✓ | ||
Free Customization | No Free Customization | Up To 30 hrs work | Up To 60 hrs work | Up To 80 hrs work | |
Deliverable |
| ⨉ | ✓ | ✓ | ✓ |
| ✓ | ⨉ | ✓ | ✓ | |
| ⨉ | ⨉ | ⨉ | ✓ | |
Analyst Support | 2-Months Analyst Support | 4-Months Analyst Support | 7-Months Analyst Support | One Year Analyst Support | |
Free Report update in next update cycle | ⨉ | ⨉ | ⨉ | ✓ | |
Free Industry Update (Within 180 days) | ⨉ | ⨉ | ⨉ | ✓ | |
Benefit | Up to 10% off on Post Purchase | Up to 20% off on Post Purchase | Up to 30% off on Post Purchase | Up to 40% off on Post Purchase | |