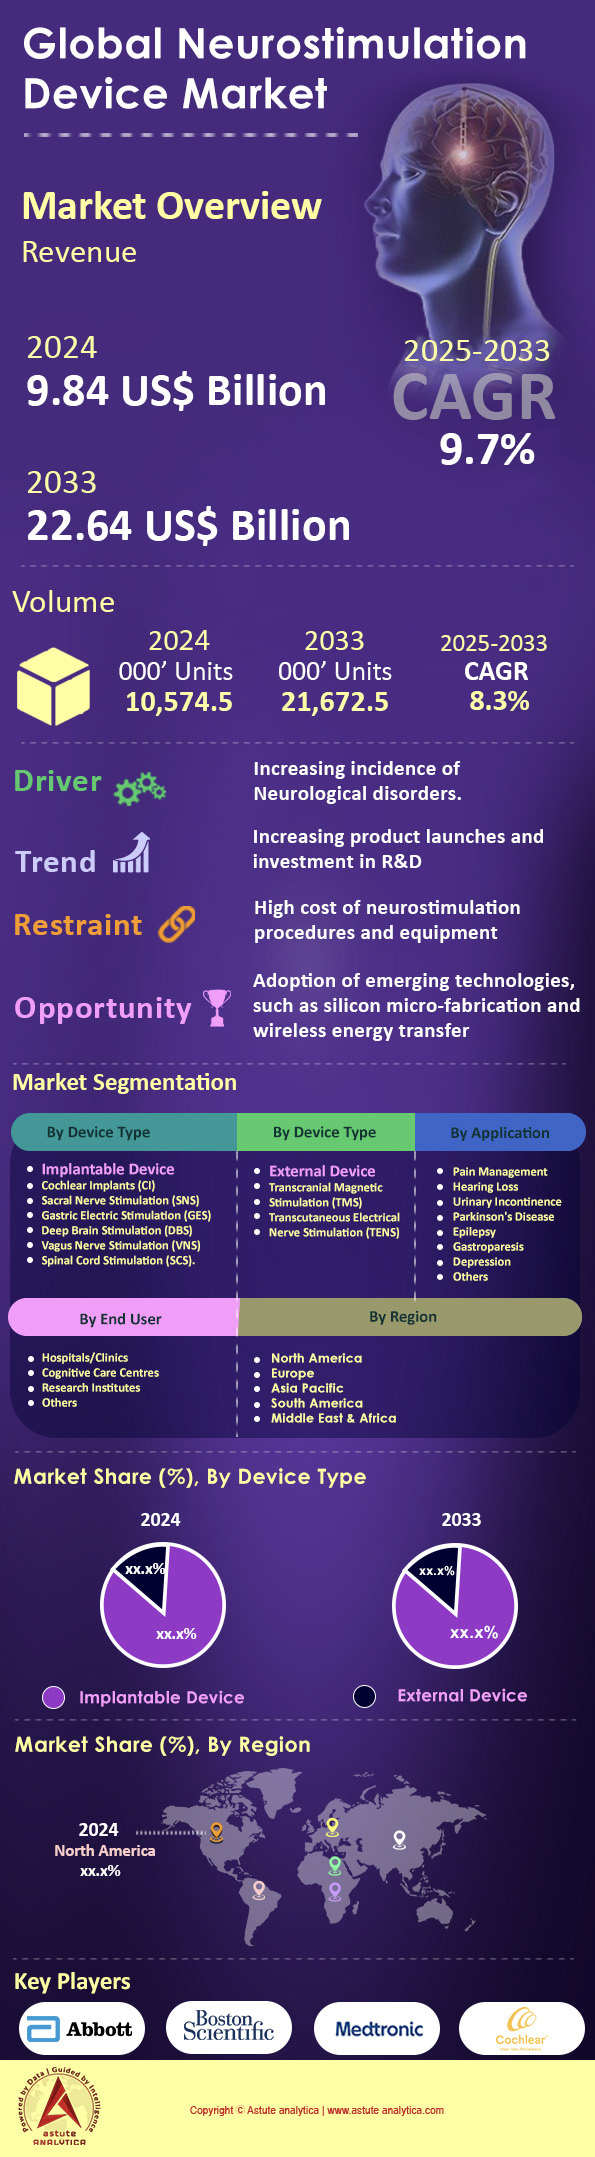
Neurostimulation Devices Market: By Type (Implantable Device and External Device); Application (Pain Management, Hearing Loss, Urinary Incontinence, Parkinson's Disease, and Others); End User (Hospitals/Clinics, Cognitive Care Centers, Research Institutes, and Others); and Region—Industry Dynamics, Market Size and Opportunity Forecast for 2025–2033
- Last Updated: Jan-2025 | Format:
![pdf]()
![powerpoint]()
![excel]() | Report ID: AA0522231 | Delivery: 2 to 4 Hours
| Report ID: AA0522231 | Delivery: 2 to 4 Hours


 | Report ID: AA0522231 | Delivery: 2 to 4 Hours
 Table 1.Price Analysis, By Device Type (Average Pricing, in US $/unit)
Table 2.Neurostimulation Device Market Size (US$ Bn), By Device Type, 2020-2033
Table 3.Neurostimulation Device Market Size (000’ Units), By Device Type, 2020-2033
Table 4.Neurostimulation Device Market Size (US$ Bn), By Application, 2020-2033
Table 5.Neurostimulation Device Market Size (000' Units), By Application, 2020-2033
Table 6.Neurostimulation Device Market Size (US$ Bn), By End User, 2020-2033
Table 7.Neurostimulation Device Market Size (000’Units), By End User, 2020-2033
Table 8.Global Neurostimulation Device Market Size (US$ Bn), By Region, 2020-2033
Table 9.Neurostimulation Device Market Size (000’ Units), By Region, 2020-2033
Table 10.North America Neurostimulation Device Market Size (US$ Bn), By Country, 2020-2033
Table 11.North America Neurostimulation Device Market Size (000' Units), By Country, 2020-2033
Table 12.North America Neurostimulation Device Market Size (US$ Bn), By Device Type, 2020-2033
Table 13.North America Neurostimulation Device Market Size (000’ Units), By Device Type, 2020-2033
Table 14.North America Neurostimulation Device Market Size (US$ Bn), By Application, 2020-2033
Table 15.North America Neurostimulation Device Market Size (000’ Units), By Application, 2020-2033
Table 16.North America Neurostimulation Device Market Size (US$ Bn), By End User, 2020-2033
Table 17.North America Neurostimulation Device Market Size (000' Units), By End User, 2020-2033
Table 18.Europe Neurostimulation Device Market Size (US$ Bn), By Country, 2020-2033
Table 19.Europe Neurostimulation Device Market Size (000' Units), By Country, 2020-2033
Table 20.Europe Neurostimulation Device Market Size (US$ Bn), By Device Type, 2020-2033
Table 21.Europe Neurostimulation Device Market Size (000’ Units), By Device Type, 2020-2033
Table 22.Europe Neurostimulation Device Market Size (US$ Bn), By Application, 2020-2033
Table 23.Europe Neurostimulation Device Market Size (000’ Units), By Application, 2020-2033
Table 24.Europe Neurostimulation Device Market Size (US$ Bn), By End User, 2020-2033
Table 25.Europe Neurostimulation Device Market Size (000' Units), By End User, 2020-2033
Table 26.Asia Pacific Neurostimulation Device Market Size (US$ Bn), By Country, 2020-2033
Table 27.Asia Pacific Neurostimulation Device Market Size (000' Units), By Country, 2020-2033
Table 28.Asia Pacific Neurostimulation Device Market Size (US$ Bn), By Device Type, 2020-2033
Table 29.Asia Pacific Neurostimulation Device Market Size (000’ Units), By Device Type, 2020-2033
Table 30.Asia Pacific Neurostimulation Device Market Size (US$ Bn), By Application, 2020-2033
Table 31.Asia Pacific Neurostimulation Device Market Size (000’ Units), By Application, 2020-2033
Table 32.Asia Pacific Neurostimulation Device Market Size (US$ Bn), By End User, 2020-2033
Table 33.Asia Pacific Neurostimulation Device Market Size (000' Units), By End User, 2020-2033
Table 34.Middle East & Africa Neurostimulation Device Market Size (US$ Bn), By Country, 2020-2033
Table 35.Middle East & Africa Neurostimulation Device Market Size (000' Units), By Country, 2020-2033
Table 36.Middle East & Africa Neurostimulation Device Market Size (US$ Bn), By Device Type, 2020-2033
Table 37.Middle East & Africa Neurostimulation Device Market Size (000’ Units), By Device Type, 2020-2033
Table 38.Middle East & Africa Neurostimulation Device Market Size (US$ Bn), By Application, 2020-2033
Table 39.Middle East & Africa Neurostimulation Device Market Size (000’ Units), By Application, 2020-2033
Table 40.Middle East & Africa Neurostimulation Device Market Size (US$ Bn), By End User, 2020-2033
Table 41.Middle East & Africa Neurostimulation Device Market Size (000' Units), By End User, 2020-2033
Table 42.South America Neurostimulation Device Market Size (US$ Bn), By Country, 2020-2033
Table 43.South America Neurostimulation Device Market Size (000' Units), By Country, 2020-2033
Table 44.South America Neurostimulation Device Market Size (US$ Bn), By Device Type, 2020-2033
Table 45.South America Neurostimulation Device Market Size (000’ Units), By Device Type, 2020-2033
Table 46.South America Neurostimulation Device Market Size (US$ Bn), By Application, 2020-2033
Table 47.South America Neurostimulation Device Market Size (000’ Units), By Application, 2020-2033
Table 48.South America Neurostimulation Device Market Size (US$ Bn), By End User, 2020-2033
Table 49.South America Neurostimulation Device Market Size (000' Units), By End User, 2020-2033
Table 50.Abbott Laboratories: Financial Analysis
Table 51.B. Braun Melsungen AG: Financial Analysis
Table 52.Boston Scientific Corporation: Financial Analysis
Table 53.BrainsWay: Financial Analysis
Table 54.Cochlear: Financial Analysis
Table 55.CONMED Corporation: Financial Analysis
Table 56.Koninklijke Philips: Financial Analysis
Table 57.Medtronic PLC: Financial Analysis
Table 58.Zimmer Biomet Holdings, Inc.: Financial Analysis
Figure 1:Global Neurostimulator Device Market, Revenue (US$ Mn) & Volume (000’Units), 2020-2033
Figure 2:Burden of Neurological Conditions in the US, By Country, rate per 100,000 population
Figure 3:Years of Life Lost & Disability-Adjusted Life years, by Disease Area (2020)
Figure 4:Neurostimulation Device Market, Covid-19 Impact & Recovery, 2020-2033, (in %)
Figure 5:Market Share Analysis, By Company, Based on Revenue (2020)
Figure 6:Neurostimulation Device Market Analysis, By Device Type, CAGR (%), 2024-2033
Figure 7:Neurostimulation Device Market Share (%), By Device Type, 2024
Figure 8:Neurostimulation Device Market Share (%), By Device Type, 2033
Figure 9:Neurostimulation Device Market Analysis, By Application, CAGR (%), 2024-2033
Figure 10:Neurostimulation Device Market Share (%), By Application, 2024
Figure 11:Neurostimulation Device Market Share (%), By Application, 2033
Figure 12:Neurostimulation Device Market Analysis, By End User, CAGR (%), 2024-2033
Figure 13:Neurostimulation Device Market Share (%), By End User, 2024
Figure 14:Neurostimulation Device Market Share (%), By End User, 2033
Figure 15:Global Neurostimulation Device Market Analysis, By Region, CAGR (%), 2024-2033
Figure 16:Global Neurostimulation Device Market, By Region, 2024
Figure 17:Global Neurostimulation Device Market, By Region, 2033
Figure 18:North America Neurostimulation Device Market: Highest Share (%) Segment
Figure 19:North America Neurostimulation Device Market: Net Opportunity Addition, in US$ Mn
Figure 20:North America Neurostimulation Device Market: Impact Analysis
Figure 21:North America Neurostimulation Device Market: Opportunity Assessment, By Device Type
Figure 22:North America Neurostimulation Device Market: Opportunity Assessment, By Application
Figure 23:North America Neurostimulation Device Market: Opportunity Assessment, By End User
Figure 24:North America Neurostimulation Device Market Share (%), By Country, 2024
Figure 25:North America Neurostimulation Device Market Share (%), By Country, 2033
Figure 26:North America Neurostimulation Device Market Share (%), By Device Type, 2024
Figure 27:North America Neurostimulation Device Market Share (%), By Device Type, 2033
Figure 28:North America Neurostimulation Device Market Share (%), By Application, 2024
Figure 29:North America Neurostimulation Device Market Share (%), By Application, 2033
Figure 30:North America Neurostimulation Device Market Share (%), By End User, 2024
Figure 31:North America Neurostimulation Device Market Share (%), By End User, 2033
Figure 32:Europe Neurostimulation Device Market: Highest Share (%) Segment
Figure 33:Europe Neurostimulation Device Market: Net Opportunity Addition, in US$ Mn
Figure 34:Europe Neurostimulation Device Market: Impact Analysis
Figure 35:Europe Neurostimulation Device Market: Opportunity Assessment, By Device Type
Figure 36:Europe Neurostimulation Device Market: Opportunity Assessment, By Application
Figure 37:Europe Neurostimulation Device Market: Opportunity Assessment, By End User
Figure 38:Europe Neurostimulation Device Market Share (%), By Country, 2024
Figure 39:Europe Neurostimulation Device Market Share (%), By Country, 2033
Figure 40:Europe Neurostimulation Device Market Share (%), By Device Type, 2024
Figure 41:Europe Neurostimulation Device Market Share (%), By Device Type, 2033
Figure 42:Europe Neurostimulation Device Market Share (%), By Application, 2024
Figure 43:Europe Neurostimulation Device Market Share (%), By Application, 2033
Figure 44:Europe Neurostimulation Device Market Share (%), By End User, 2024
Figure 45:Europe Neurostimulation Device Market Share (%), By End User, 2033
Figure 46:Asia Pacific Neurostimulation Device Market: Highest Share (%) Segment
Figure 47:Asia Pacific Neurostimulation Device Market: Net Opportunity Addition, in US$ Mn
Figure 48:Asia Pacific Neurostimulation Device Market: Impact Analysis
Figure 49:Asia Pacific Neurostimulation Device Market: Opportunity Assessment, By Device Type
Figure 50:Asia Pacific Neurostimulation Device Market: Opportunity Assessment, By Application
Figure 51:Asia Pacific Neurostimulation Device Market: Opportunity Assessment, By End User
Figure 52:Asia Pacific Neurostimulation Device Market Share (%), By Country, 2024
Figure 53:Asia Pacific Neurostimulation Device Market Share (%), By Country, 2033
Figure 54:Asia Pacific Neurostimulation Device Market Share (%), By Device Type, 2024
Figure 55:Asia Pacific Neurostimulation Device Market Share (%), By Device Type, 2033
Figure 56:Asia Pacific Neurostimulation Device Market Share (%), By Application, 2024
Figure 57:Asia Pacific Neurostimulation Device Market Share (%), By Application, 2033
Figure 58:Asia Pacific Neurostimulation Device Market Share (%), By End User, 2024
Figure 59:Asia Pacific Neurostimulation Device Market Share (%), By End User, 2033
Figure 60:Middle East & Africa Neurostimulation Device Market: Highest Share (%) Segment
Figure 61:Middle East & Africa Neurostimulation Device Market: Net Opportunity Addition, in US$ Mn
Figure 62:Middle East & Africa Neurostimulation Device Market: Impact Analysis
Figure 63:Middle East & Africa Neurostimulation Device Market: Opportunity Assessment, By Device Type
Figure 64:Middle East & Africa Neurostimulation Device Market: Opportunity Assessment, By Application
Figure 65:Middle East & Africa Neurostimulation Device Market: Opportunity Assessment, By End User
Figure 66:Middle East & Africa Neurostimulation Device Market Share (%), By Country, 2024
Figure 67:Middle East & Africa Neurostimulation Device Market Share (%), By Country, 2033
Figure 68:Middle East & Africa Neurostimulation Device Market Share (%), By Device Type, 2024
Figure 69:Middle East & Africa Neurostimulation Device Market Share (%), By Device Type, 2033
Figure 70:Middle East & Africa Neurostimulation Device Market Share (%), By Application, 2024
Figure 71:Middle East & Africa Neurostimulation Device Market Share (%), By Application, 2033
Figure 72:Middle East & Africa Neurostimulation Device Market Share (%), By End User, 2024
Figure 73:Middle East & Africa Neurostimulation Device Market Share (%), By End User, 2033
Figure 74:South America Neurostimulation Device Market: Highest Share (%) Segment
Figure 75:South America Neurostimulation Device Market: Net Opportunity Addition, in US$ Mn
Figure 76:South America Neurostimulation Device Market: Impact Analysis
Figure 77:South America Neurostimulation Device Market: Opportunity Assessment, By Device Type
Figure 78:South America Neurostimulation Device Market: Opportunity Assessment, By Application
Figure 79:South America Neurostimulation Device Market: Opportunity Assessment, By End User
Figure 80:South America Neurostimulation Device Market Share (%), By Country, 2024
Figure 81:South America Neurostimulation Device Market Share (%), By Country, 2033
Figure 82:South America Neurostimulation Device Market Share (%), By Device Type, 2024
Figure 83:South America Neurostimulation Device Market Share (%), By Device Type, 2033
Figure 84:South America Neurostimulation Device Market Share (%), By Application, 2024
Figure 85:South America Neurostimulation Device Market Share (%), By Application, 2033
Figure 86:South America Neurostimulation Device Market Share (%), By End User, 2024
Figure 87:South America Neurostimulation Device Market Share (%), By End User, 2033
Figure 88:Abbott Laboratories: Business Revenue Segmentation, 2024
Figure 89:Abbott Laboratories: Geography Revenue Segmentation, 2024
Figure 90:B. Braun Melsungen AG: Geographical Revenue Segmentation, 2024
Figure 91:Boston Scientific Corporation: Business Revenue Segmentation, 2024
Figure 92:Boston Scientific Corporation: Geographical Revenue Segmentation, 2024
Figure 93:BrainsWay: Geographic Revenue Segmentation, 2024
Figure 94:Cochlear: Business Revenue Segmentation, 2024
Figure 95:Cochlear: Geographical Revenue Segmentation, 2024
Figure 96:CONMED Corporation: Business Revenue Segmentation, 2024
Figure 97:CONMED Corporation: Geographical Revenue Segmentation, 2024
Figure 98:Koninklijke Philips: Business Revenue Segmentation, 2024
Figure 99:Koninklijke Philips: Geographical Revenue Segmentation, 2024
Figure 100:Medtronic PLC: Business Revenue Segmentation, 2024
Figure 101:Medtronic PLC: Geographical Revenue Segmentation, 2024
Figure 102:Zimmer Biomet Holdings, Inc.: Business Revenue Segmentation, 2024
Figure 103:Zimmer Biomet Holdings, Inc.: Geographical Revenue Segmentation, 2024


Choose License Type


Features | Type of License | ||||
Data Book | Single User |   Multi User | Corporate | ||
| e-Access | ✓ | ✓ | ✓ | ✓ | |
User Sharing | 1 User Only | 1 User Only | Up to 7 Users | Unlimited User Access | |
⨉ | ⨉ | ⨉ | ✓ | ||
Free Customization | No Free Customization | Up To 30 hrs work | Up To 60 hrs work | Up To 80 hrs work | |
Deliverable |
| ⨉ | ✓ | ✓ | ✓ |
| ✓ | ⨉ | ✓ | ✓ | |
| ⨉ | ⨉ | ⨉ | ✓ | |
Analyst Support | 2-Months Analyst Support | 4-Months Analyst Support | 7-Months Analyst Support | One Year Analyst Support | |
Free Report update in next update cycle | ⨉ | ⨉ | ⨉ | ✓ | |
Free Industry Update (Within 180 days) | ⨉ | ⨉ | ⨉ | ✓ | |
Benefit | Up to 10% off on Post Purchase | Up to 20% off on Post Purchase | Up to 30% off on Post Purchase | Up to 40% off on Post Purchase | |