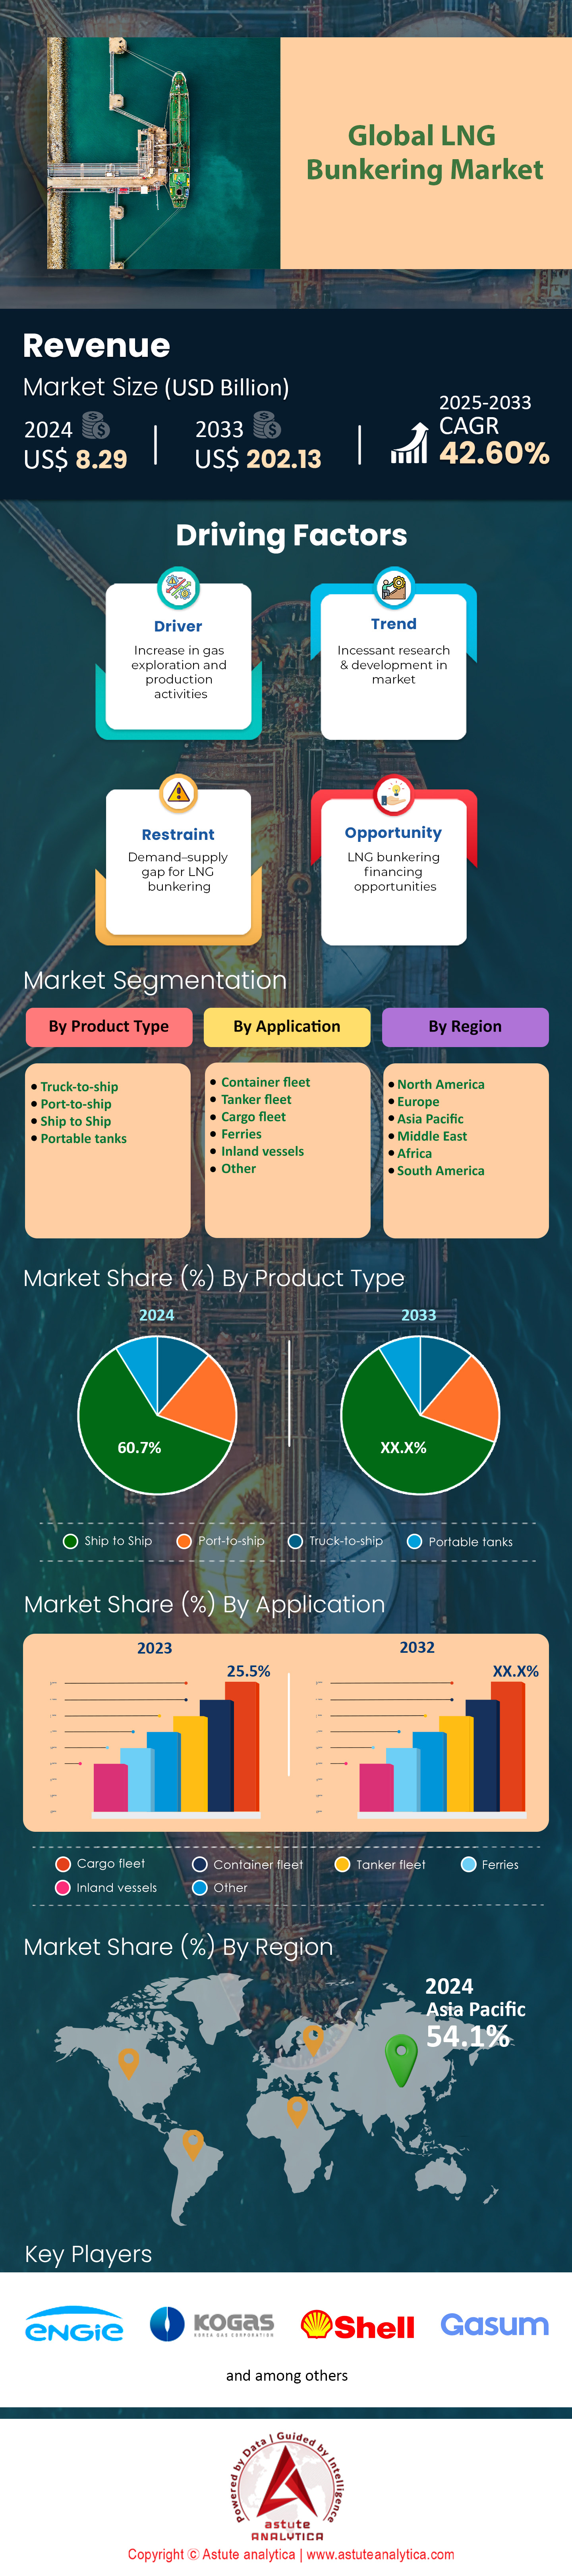
LNG Bunkering Market: By Product Type (Truck-to-Ship, Port-to-Ship, Ship-to-Ship, and Portable Tanks); Application (Container Fleet, Tanker Fleet, Cargo Fleet, Ferries, Inland Vessels, and Others); and Region—Market Size, Industry Dynamics, Opportunity Analysis and Forecast for 2025–2033
- Last Updated: Feb-2025 | Format:
![pdf]()
![powerpoint]()
![excel]() | Report ID: AA0222148 | Delivery: 2 to 4 Hours
| Report ID: AA0222148 | Delivery: 2 to 4 Hours


 | Report ID: AA0222148 | Delivery: 2 to 4 Hours
 Table 1.International maritime trade in 2018–2019, Million Tons
Table 2.Top Bunkering Ports in Asia Pacific
Table 3.LNG Bunkering Vessels, By Capacity
Table 4.Global LNG Bunkering Market Size (US$ Mn), by Product Type, 2020 - 2033
Table 5.Global LNG Bunkering Market Size (US$ Mn), by Application, 2020 - 2033
Table 6.Global LNG Bunkering Market Size (US$ Mn), By Geography, 2020 - 2033
Table 7.North America LNG Bunkering Market Size (US$ Mn), By Country, 2020 - 2033
Table 8.North America LNG Bunkering Market Size (US$ Mn), by Product Type, 2020 - 2033
Table 9.North America LNG Bunkering Market Size (US$ Mn), by Application, 2020 - 2033
Table 10.Europe LNG Bunkering Market Size (US$ Mn), By Country, 2020 - 2033
Table 11.Europe LNG Bunkering Market Size (US$ Mn), by Product Type, 2020 - 2033
Table 12.Europe LNG Bunkering Market Size (US$ Mn), by Application, 2020 - 2033
Table 13.Asia Pacific LNG Bunkering Market Size (US$ Mn), By Country, 2020 - 2033
Table 14.Asia Pacific LNG Bunkering Market Size (US$ Mn), by Product Type, 2020 - 2033
Table 15.Asia Pacific LNG Bunkering Market Size (US$ Mn), by Application, 2020 - 2033
Table 16.MEA LNG Bunkering Market Size (US$ Mn), By Country, 2020 - 2033
Table 17.MEA LNG Bunkering Market Size (US$ Mn), by Product Type, 2020 - 2033
Table 18.MEA LNG Bunkering Market Size (US$ Mn), by Application, 2020 - 2033
Table 19.South America LNG Bunkering Market Size (US$ Mn), By Country, 2020 - 2033
Table 20.South America LNG Bunkering Market Size (US$ Mn), by Product Type, 2020 - 2033
Table 21.South America LNG Bunkering Market Size (US$ Mn), by Application, 2020 - 2033
Table 22.Japan LNG Bunkering Market Size (US$ Mn), By Country, 2020 - 2033
Table 23.Japan LNG Bunkering Market Size (US$ Mn), by Product Type, 2020 - 2033
Table 24.Japan LNG Bunkering Market Size (US$ Mn), by Application, 2020 - 2033
Table 25.Bomin Linde LNG GmbH Co, & KG: Financial Analysis
Table 26.Engie SA: Financial Analysis
Table 27.ENN Energy Holdings Ltd.: Financial Analysis
Table 28.Naturgy.: Financial Analysis
Table 29.GazproBneft Marine Bunker LLC: Financial Analysis
Table 30.kawasaki heavy industries Ltd: Financial Analysis
Table 31.Sembcorp Marine Ltd.: Financial Analysis
Table 32.Gasum: Financial Analysis
Table 33.Equinor: Financial Analysis
Table 34.TotalEnergies: Financial Analysis
Table 35.Toyota Tsusho Corp.: Financial Analysis
Table 36.Royal Dutch Shell PLC: Financial Analysis
Table 37.Mitsui O.S.K. Lines, Ltd.: Financial Analysis
Figure 1:Executive Summary: Global LNG Bunkering Market Size, By Value, 2024 - 2033 (US$ Billion)
Figure 2:Executive Summary: Global LNG Bunkering Market Size, By YoY Growth, 2024 - 2033 (%)
Figure 3:International maritime trade in cargo ton-miles, 1999–2024 (Billion ton-miles; index: 1999 = 100)
Figure 4:COVID-19 Impact Assessment on Market Growth Trend
Figure 5:Market Share Analysis, By Company, Based on Revenue (2024)
Figure 6:Market Revenue Estimates and Forecast (US$ Mn), 2024 - 2033
Figure 7:Price Analysis, by Region, 2024 (Average Pricing, in US$ Per Tons)
Figure 8:Global LNG Bunkering Market, By Type, CAGR (%), 2024 - 2033
Figure 9:Global LNG Bunkering Market Share (%), by Product Type, 2024
Figure 10:Global LNG Bunkering Market Share (%), by Product Type, 2033
Figure 11:Global LNG Bunkering Market, By Application, CAGR (%), 2024 - 2033
Figure 12:Global LNG Bunkering Market Share (%), by Application, 2024
Figure 13:Global LNG Bunkering Market Share (%), by Application, 2033
Figure 14:Global LNG Bunkering Market, Top Segment CAGR (%), 2024 - 2033
Figure 15:Global LNG Bunkering Market Share (%), by Geography, 2024
Figure 16:Global LNG Bunkering Market Share (%), by Geography, 2033
Figure 17:North America LNG Bunkering Market, Top Segment CAGR (%), 2024 - 2033
Figure 18:North America LNG Bunkering Market Share (%), by Country, 2024
Figure 19:North America LNG Bunkering Market Share (%), by Country, 2033
Figure 20:North America LNG Bunkering Market Share (%), by Product Type, 2024
Figure 21:North America LNG Bunkering Market Share (%), by Product Type, 2033
Figure 22:North America LNG Bunkering Market Share (%), by Application, 2024
Figure 23:North America LNG Bunkering Market Share (%), by Application, 2033
Figure 24:Europe LNG Bunkering Market, Top Segment CAGR (%), 2024 - 2033
Figure 25:Europe LNG Bunkering Market Share (%), by Country, 2024
Figure 26:Europe LNG Bunkering Market Share (%), by Country, 2033
Figure 27:Europe LNG Bunkering Market Share (%), by Product Type, 2024
Figure 28:Europe LNG Bunkering Market Share (%), by Product Type, 2033
Figure 29:Europe LNG Bunkering Market Share (%), by Application, 2024
Figure 30:Europe LNG Bunkering Market Share (%), by Application, 2033
Figure 31:Asia Pacific LNG Bunkering Market, Top Segment CAGR (%), 2024 - 2033
Figure 32:Asia Pacific LNG Bunkering Market Share (%), by Country, 2024
Figure 33:Asia Pacific LNG Bunkering Market Share (%), by Country, 2033
Figure 34:Asia Pacific LNG Bunkering Market Share (%), by Product Type, 2024
Figure 35:Asia Pacific LNG Bunkering Market Share (%), by Product Type, 2033
Figure 36:Asia Pacific LNG Bunkering Market Share (%), by Application, 2024
Figure 37:Asia Pacific LNG Bunkering Market Share (%), by Application, 2033
Figure 38:MEA LNG Bunkering Market, Top Segment CAGR (%), 2024 - 2033
Figure 39:MEA LNG Bunkering Market Share (%), by Country, 2024
Figure 40:MEA LNG Bunkering Market Share (%), by Country, 2033
Figure 41:MEA LNG Bunkering Market Share (%), by Product Type, 2024
Figure 42:MEA LNG Bunkering Market Share (%), by Product Type, 2033
Figure 43:MEA LNG Bunkering Market Share (%), by Application, 2024
Figure 44:MEA LNG Bunkering Market Share (%), by Application, 2033
Figure 45:South America LNG Bunkering Market, Top Segment CAGR (%), 2024 - 2033
Figure 46:South America LNG Bunkering Market Share (%), by Country, 2024
Figure 47:South America LNG Bunkering Market Share (%), by Country, 2033
Figure 48:South America LNG Bunkering Market Share (%), by Product Type, 2024
Figure 49:South America LNG Bunkering Market Share (%), by Product Type, 2033
Figure 50:South America LNG Bunkering Market Share (%), by Application, 2024
Figure 51:South America LNG Bunkering Market Share (%), by Application, 2033
Figure 52:Japan LNG Bunkering Market, Top Segment CAGR (%), 2024 - 2033
Figure 53:Japan LNG Bunkering Market Share (%), by Country, 2024
Figure 54:Japan LNG Bunkering Market Share (%), by Country, 2033
Figure 55:Japan LNG Bunkering Market Share (%), by Product Type, 2024
Figure 56:Japan LNG Bunkering Market Share (%), by Product Type, 2033
Figure 57:Japan LNG Bunkering Market Share (%), by Application, 2024
Figure 58:Japan LNG Bunkering Market Share (%), by Application, 2033
Figure 59:Bomin Linde LNG GmbH Co, & KG: Business Revenue Segmentation, 2024
Figure 60:Bomin Linde LNG GmbH Co, & KG: Geographical Revenue Segmentation, 2024
Figure 61:Engie SA: Business Revenue Segmentation, 2024
Figure 62:Engie SA: Geographical Revenue Segmentation, 2024
Figure 63:ENN Energy Holdings Ltd.: Business Revenue Segmentation, 2024
Figure 64:ENN Energy Holdings Ltd.: Geographical Revenue Segmentation, 2024
Figure 65:Naturgy: Business Revenue Segmentation, 2024
Figure 66:Naturgy: Geographical Revenue Segmentation, 2024
Figure 67:GazproBneft Marine Bunker LLC: Business Revenue Segmentation, 2024
Figure 68:Kawasaki Heavy Industries Ltd.: Business Revenue Segmentation, 2024
Figure 69:Kawasaki Heavy Industries Ltd.: Geographical Revenue Segmentation, 2024
Figure 70:Sembcorp Marine Ltd.: Business Revenue Segmentation, 2024
Figure 71:Sembcorp Marine Ltd.: Geographical Revenue Segmentation, 2024
Figure 72:Gasum: Business Revenue Segmentation, 2024
Figure 73:Gasum: Geographical Revenue Segmentation, 2024
Figure 74:Equinor: Business Revenue Segmentation, 2024
Figure 75:TotalEnergies: Business Revenue Segmentation, 2024
Figure 76:TotalEnergies: Geographical Revenue Segmentation, 2024
Figure 77:Toyota Tsusho Corp.: Business Revenue Segmentation, 2024
Figure 78:Toyota Tsusho Corp.: Geographical Revenue Segmentation, 2024
Figure 79:Royal Dutch Shell PLC: Business Revenue Segmentation, 2024
Figure 80:Royal Dutch Shell PLC: Geographical Revenue Segmentation, 2024
Figure 81:Mitsui O.S.K. Lines, Ltd.: Business Revenue Segmentation, 2024


Choose License Type


Features | Type of License | ||||
Data Book | Single User |   Multi User | Corporate | ||
| e-Access | ✓ | ✓ | ✓ | ✓ | |
User Sharing | 1 User Only | 1 User Only | Up to 7 Users | Unlimited User Access | |
⨉ | ⨉ | ⨉ | ✓ | ||
Free Customization | No Free Customization | Up To 30 hrs work | Up To 60 hrs work | Up To 80 hrs work | |
Deliverable |
| ⨉ | ✓ | ✓ | ✓ |
| ✓ | ⨉ | ✓ | ✓ | |
| ⨉ | ⨉ | ⨉ | ✓ | |
Analyst Support | 2-Months Analyst Support | 4-Months Analyst Support | 7-Months Analyst Support | One Year Analyst Support | |
Free Report update in next update cycle | ⨉ | ⨉ | ⨉ | ✓ | |
Free Industry Update (Within 180 days) | ⨉ | ⨉ | ⨉ | ✓ | |
Benefit | Up to 10% off on Post Purchase | Up to 20% off on Post Purchase | Up to 30% off on Post Purchase | Up to 40% off on Post Purchase | |