Japan Smart Cities Market: By Component (Communication Infrastructure (Telecom Network), Hardware, Software, and Services); Application (Administration (Smart Governance), Buildings, Commercial (Enterprise), Construction, Education, and Others); City Topography (Developed Economies (New and Existing) and Emerging Economies (New and Existing)—Market Size, Industry Dynamics, Opportunity Analysis and Forecast for 2025–2033
- Last Updated: Jan-2025 | Format:
![pdf]()
![powerpoint]()
![excel]() | Report ID: AA0422214 | Delivery: 2-4 hours
| Report ID: AA0422214 | Delivery: 2-4 hours


 | Report ID: AA0422214 | Delivery: 2-4 hours
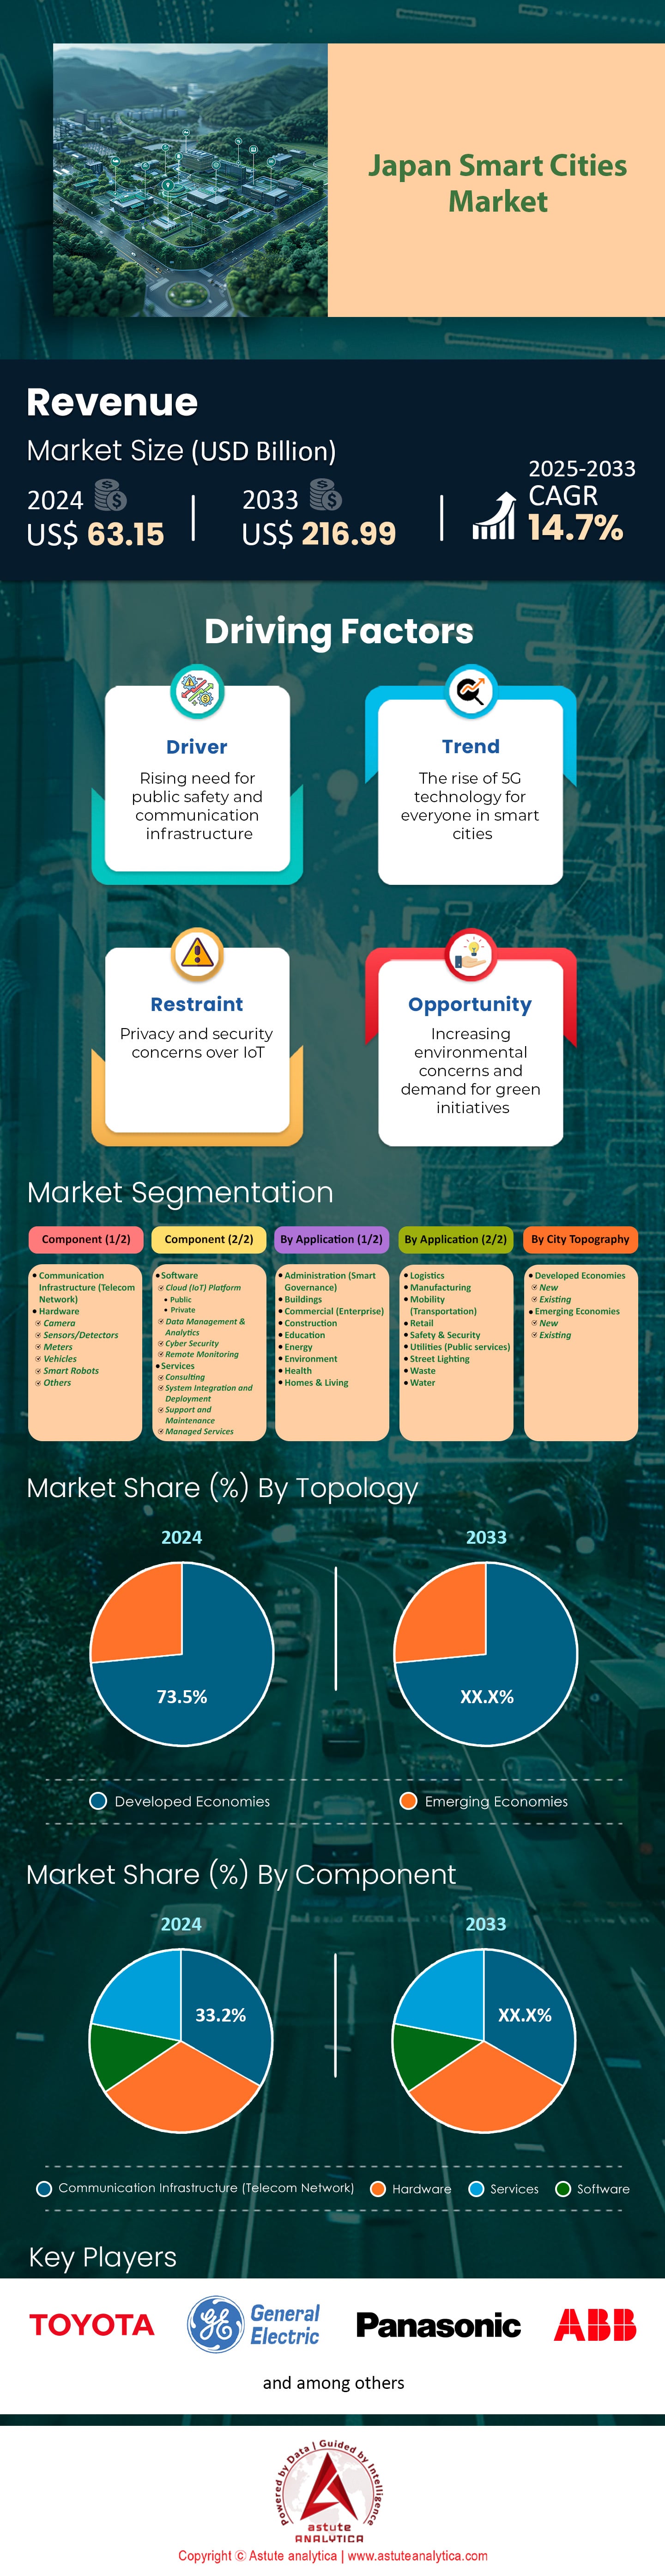
 Table 1 Japan Smart Cities Market Size (US$ Bn), by Value, by Component, 2020-2033
Table 2 Japan Smart Cities Market Size (US$ Bn), by Value, by Application, 2020-2033
Table 3 Japan Smart Cities Market Size (US$ Bn), by Value, by City Topography 2020-2033
Table 4 Chunghwa Telecom Company Ltd.: Products
Table 5 Cisco Systems Inc.: Financial Analysis
Table 6 Deutsche Telekom: Products
Table 7 Deutsche Telekom: Financial Analysis
Table 8 Cisco Systems Inc.: Products
Table 9 Cisco Systems Inc.: Financial Analysis
Table 10 Qualcomm Technologies Inc.: Products
Table 11 Nokia Corporation: Products
Table 12 Orange S.A.: Products
Table 13 Reliance Jio Infocomm Limited: Products
Table 14 Telstra Corp Ltd: Products
Table 15 Thales Group: Products
Table 16 Telefonica SA: Products
Table 17 Vodafone Group plc: Products
Table 18 Verizon Communication Ltd.: Products
Table 19 Verizon Communication Ltd. : Financial Analysis
Table 20 Other Prominent Players: Company Name
Figure 1 Executive Summary: Japan Smart Cities Market Size, By Value, 2024-2033 (USD Billion)
Figure 2 Executive Summary: Japan Smart Cities Market Size, By YoY Growth, 2024-2033 (%)
Figure 3 Executive Summary: Smart Citizen Services Segment Dominating Market
Figure 4 Executive Summary: Japan Smart Cities Market Share 2024 & 2033 by Emerging Economies Segment
Figure 5 Technology Adoption Analysis: Technology Adoption Analysis
Figure 6 Technology Adoption Analysis: Computing Technology Adoption Analysis
Figure 7 Technology Adoption Analysis: Networking Technology Adoption Analysis
Figure 8 5G Service Support: Artificial Intelligence driven services
Figure 9 Covid-19 Impact Assessment: Analysis
Figure 10 Japan Smart Cities Market Timeseries Analysis: Japan Market Size and Forecast (US$ Bn), 2024-2033
Figure 11 Competitive Dashboard: Market Share Analysis By Company, Based on Revenue (2024)
Figure 12 Japan Smart Cities Market, By Component, by Value, CAGR (%), 2024-2033
Figure 13 Japan Smart Cities Market Share (%), by Value, by Component, 2024
Figure 14 Japan Smart Cities Market Share (%), by Value, by Component, 2033
Figure 15 Japan Smart Cities Market, by Value, by Application, CAGR (%), 2024-2033
Figure 16 Japan Smart Cities Market Share (%), by Value, by Application, 2024
Figure 17 Japan Smart Cities Market Share (%), by Value, by Application, 2033
Figure 18 Japan Smart Cities Market, by Value, By City Topography, CAGR (%), 2024-2033
Figure 19 Japan Smart Cities Market Share (%), by Value, by City Topography 2024
Figure 20 Japan Smart Cities Market Share (%), by Value, by City Topography 2033
Figure 21 Cisco Systems Inc.: Business Revenue Segmentation, 2024
Figure 22 Cisco Systems Inc.: Geographical Revenue Segmentation, 2024
Figure 23 Cisco Systems Inc.: Business Revenue Segmentation, 2024
Figure 24 Huawei Technologies: Business Revenue Segmentation, 2024
Figure 25 Huawei Technologies: Geographical Revenue Segmentation, 2024
Figure 26 Verizon Communication Ltd.: Business Revenue Segmentation, 2024


Choose License Type


Features | Type of License | ||||
Data Book | Single User |   Multi User | Corporate | ||
| e-Access | ✓ | ✓ | ✓ | ✓ | |
User Sharing | 1 User Only | 1 User Only | Up to 7 Users | Unlimited User Access | |
⨉ | ⨉ | ⨉ | ✓ | ||
Free Customization | No Free Customization | Up To 30 hrs work | Up To 60 hrs work | Up To 80 hrs work | |
Deliverable |
| ⨉ | ✓ | ✓ | ✓ |
| ✓ | ⨉ | ✓ | ✓ | |
| ⨉ | ⨉ | ⨉ | ✓ | |
Analyst Support | 2-Months Analyst Support | 4-Months Analyst Support | 7-Months Analyst Support | One Year Analyst Support | |
Free Report update in next update cycle | ⨉ | ⨉ | ⨉ | ✓ | |
Free Industry Update (Within 180 days) | ⨉ | ⨉ | ⨉ | ✓ | |
Benefit | Up to 10% off on Post Purchase | Up to 20% off on Post Purchase | Up to 30% off on Post Purchase | Up to 40% off on Post Purchase | |