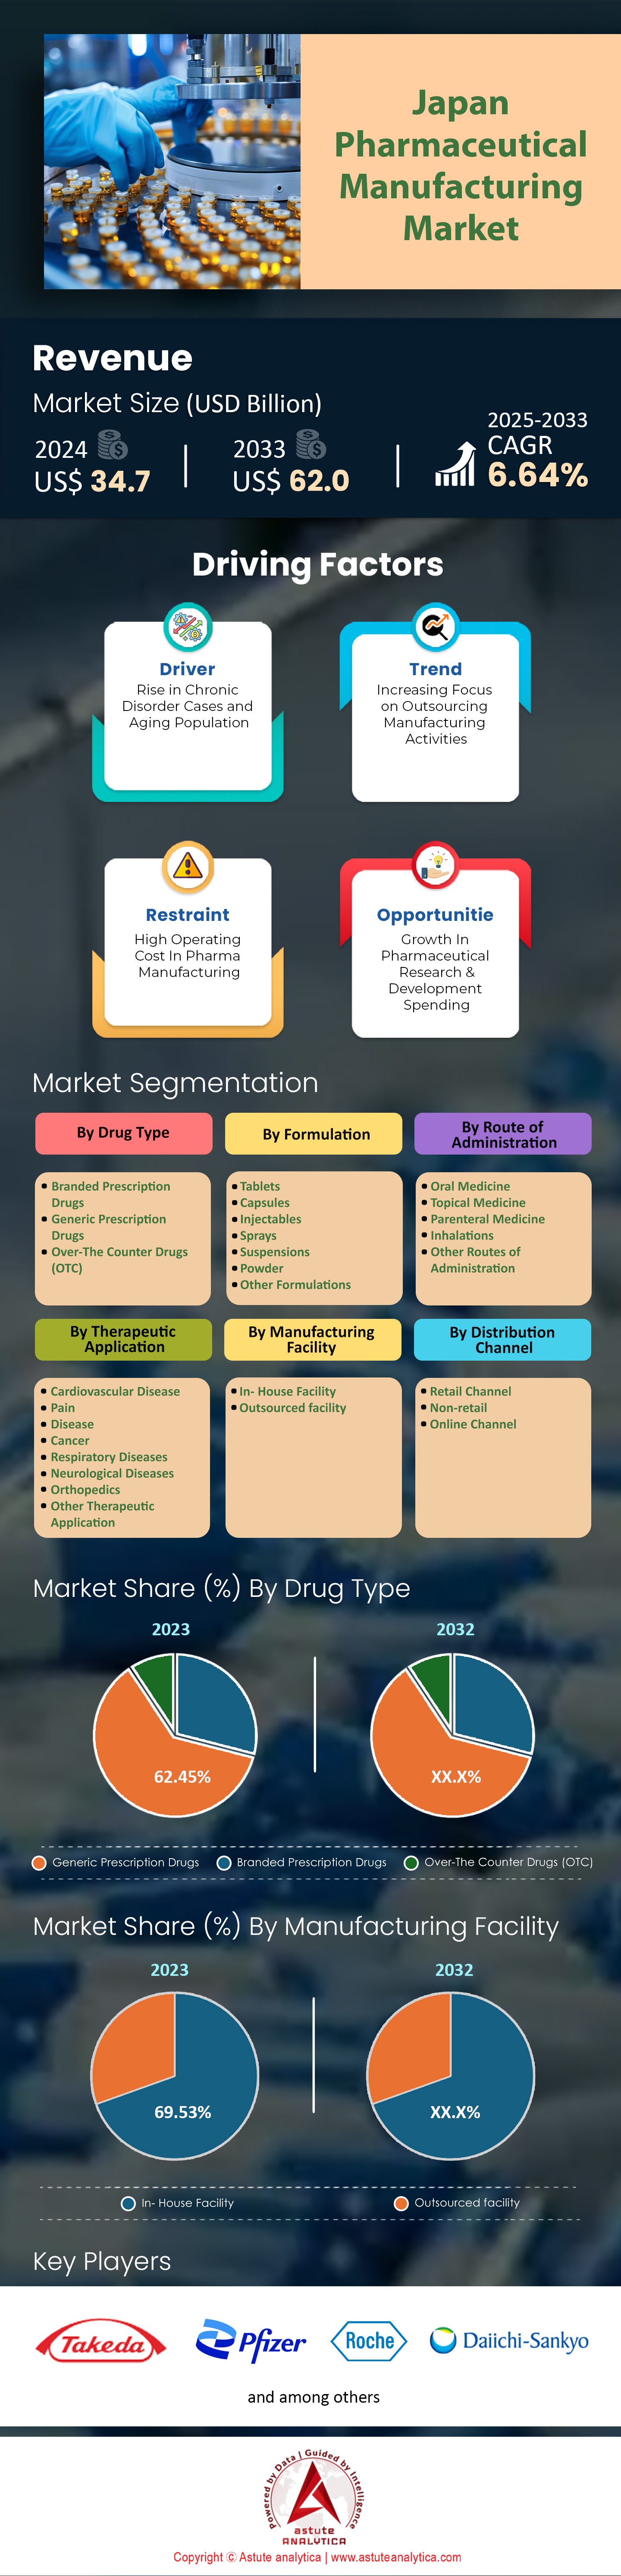
Japan Pharmaceutical Manufacturing Market: By Drug Type (Branded Prescription Drugs, Generic Prescription Drugs, Over-The Counter Drugs (OTC)); Formulation (Tablets, Capsules, Injectables, Sprays, Suspensions, Powder, Other Formulations); Route of Administration (Oral Medicine, Topical Medicine, Parenteral Medicine, Inhalations, Other Routes of Administration); Therapeutic Application (Cardiovascular Disease, Pain, Disease, Cancer, Respiratory Diseases, Neurological Diseases, Orthopedics, Other Therapeutic Application); Manufacturing Facility (In- House Facility and Outsourced facility); Distribution Channel (Retail Channel, Non-retail, and Online Channel)—Market Size, Industry Dynamics, Opportunity Analysis and Forecast for 2025–2033
- Last Updated: Jan-2025 | Format:
![pdf]()
![powerpoint]()
![excel]() | Report ID: AA0923598 | Delivery: 2 to 4 Hours
| Report ID: AA0923598 | Delivery: 2 to 4 Hours


 | Report ID: AA0923598 | Delivery: 2 to 4 Hours
 Table:1 Industry Outlook: Number of Deaths by Cause in Japan (Top 10 Diseases) in 2020
Table:2 Driver: Top Pharma Companies Using Artificial Intelligence (AI)
Table:3 Market Dynamics and Trends: Impact Analysis of Market Dynamics
Table:4 Covid -19 Drug Cost Analysis: Drug Cost Analysis for Covid-19 w.r.t Other Developed Countries (USD Bn)
Table:5 Competitive Dashboard: Competitor Mapping & Benchmarking
Table:6 Japan Pharmaceutical Manufacturing Market Size (US$ Bn), By Drug Type, 2020-2033
Table:7 Japan Pharmaceutical Manufacturing Market Size (MT), By Drug Type, 2020-2033
Table:8 Japan Pharmaceutical Manufacturing Market Size (US$ Bn), By Formulation, 2020-2033
Table:9 Japan Pharmaceutical Manufacturing Market Size (MT), By Formulation, 2020-2033
Table:10 Japan Pharmaceutical Manufacturing Market Size (US$ Bn), By Route of Administration, 2020-2033
Table:11 Japan Pharmaceutical Manufacturing Market Size (MT), By Route of Administration, 2020-2033
Table:12 Japan Pharmaceutical Manufacturing Market Size (US$ Bn), By Therapeutic Application 2020-2033
Table:13 Japan Pharmaceutical Manufacturing Market Size (MT), By Therapeutic Application, 2020-2033
Table:14 Japan Pharmaceutical Manufacturing Market Size (US$ Bn), By Manufacturing Facility 2020-2033
Table:15 Japan Pharmaceutical Manufacturing Market Size (MT), By Manufacturing Facility, 2020-2033
Table:16 Japan Pharmaceutical Manufacturing Market Size (US$ Bn), By Distribution Channel 2020-2033
Table:17 Japan Pharmaceutical Manufacturing Market Size (MT), By Distribution Channel, 2020-2033
Table:18 Takeda Pharmaceutical Company Limited: Recent Developments
Table:19 Takeda Pharmaceutical Company Limited: Products
Table:20 Takeda Pharmaceutical Company Limited: Financial Analysis
Table:21 Daiichi Sankyo Company, Limited: Recent Developments
Table:22 Daiichi Sankyo Company, Limited: Products
Table:23 Daiichi Sankyo Company, Limited: Financial Analysis
Table:24 Chugai Pharmaceutical Co., Ltd: Recent Developments
Table:25 Chugai Pharmaceutical Co., Ltd: Products
Table:26 Chugai Pharmaceutical Co., Ltd: Financial Analysis
Table:27 Astellas Pharma Inc.: Recent Developments
Table:28 Astellas Pharma Inc.: Products
Table:29 Astellas Pharma Inc.: Financial Analysis
Table:30 Abbott Laboratories: Recent Developments
Table:31 Abbott Laboratories: Products
Table:32 Abbott Laboratories: Financial Analysis
Table:33 AbbVie Inc.: Recent Developments
Table:34 AbbVie Inc.: Products
Table:35 AbbVie Inc.: Financial Analysis
Table:36 Acadia Pharmaceuticals Inc.: Recent Developments
Table:37 Acadia Pharmaceuticals Inc.: Products
Table:38 Acadia Pharmaceuticals Inc.: Financial Analysis
Table:39 Aenova Group GmbH: Recent Developments
Table:40 Aenova Group GmbH: Products
Table:41 Aenova Group GmbH: Financial Analysis
Table:42 Amgen Inc.: Recent Developments
Table:43 Amgen Inc.: Products
Table:44 Amgen Inc.: Financial Analysis
Table:45 AstraZeneca plc: Recent Developments
Table:46 AstraZeneca plc: Products
Table:47 AstraZeneca plc: Financial Analysis
Table:48 Bayer AG: Recent Developments
Table:49 Bayer AG: Products
Table:50 Bayer AG: Financial Analysis
Table:51 Biogen Inc.: Recent Developments
Table:52 Biogen Inc.: Products
Table:53 Biogen Inc.: Financial Analysis
Table:54 Boehringer Ingelheim International GmbH: Recent Developments
Table:55 Boehringer Ingelheim International GmbH: Products
Table:56 Boehringer Ingelheim International GmbH: Financial Analysis
Table:57 Eli Lilly and Company: Recent Developments
Table:58 Eli Lilly and Company: Products
Table:59 Eli Lilly and Company: Financial Analysis
Table:60 F. Hoffmann-La Roche AG: Recent Developments
Table:61 F. Hoffmann-La Roche AG: Products
Table:62 F. Hoffmann-La Roche AG: Financial Analysis
Table:63 GSK plc: Recent Developments
Table:64 GSK plc: Products
Table:65 GSK plc: Financial Analysis
Table:66 Merck KgaA: Recent Developments
Table:67 Merck KgaA: Products
Table:68 Merck KGaA: Financial Analysis
Table:69 Novartis AG: Recent Developments
Table:70 Novartis AG: Products
Table:71 Novartis AG: Financial Analysis
Table:72 Novo Nordisk A/S: Recent Developments
Table:73 Novo Nordisk A/S: Products
Table:74 Novo Nordisk A/S: Financial Analysis
Table:75 Pfizer Inc.: Recent Developments
Table:76 Pfizer Inc.: Products
Table:77 Pfizer Inc.: Financial Analysis
Table:78 Sanofi SA: Recent Developments
Table:79 Sanofi SA: Products
Table:80 Sanofi SA: Financial Analysis
Table:81 Other Prominent Players
Figure: 1 Executive Summary: Japan Pharmaceutical Manufacturing Market, Revenue (US$ Bn), 2020-2033
Figure: 2 Executive Summary: Japan Pharmaceutical Manufacturing Market, Volume (MT), 2020-2033
Figure: 3 Japan Medicinal and Pharmaceutical Product Import, 2016-2024 (US$ Bn)
Figure: 4 Industry Outlook: Japan Medicinal and Pharmaceutical Product Export, 2016-2024 (US$ Bn)
Figure: 5 Industry Outlook: Japan Medicinal and Pharmaceutical Product Import, 2016-2024 (US$ Bn)
Figure: 6 Driver: Leading causes of death in Japan, 2020
Figure: 7 Restraint: Cost Breakdown of Pharmaceutical Manufacturing
Figure: 8 Japan Pharmaceutical Manufacturing Market, Covid-19 Impact & Recovery, 2020-2033, Y-o-Y (%)
Figure: 9 Covid -19 Impact & Recovery: Japan Pharmaceutical Manufacturing Market, Covid-19 Impact & Recovery, 2020-2033, Y-o-Y (%)
Figure: 10 Product Price Analysis: Product Pricing, By Drug Type, US$
Figure: 11 Competitive Dashboard: Market Share Analysis, By Company, Based on Revenue (2024)
Figure: 12 Japan Pharmaceutical Manufacturing Market, By Drug Type, CAGR (%), 2024-2033
Figure: 13 Japan Pharmaceutical Manufacturing Market Share (%), By Drug Type, 2024
Figure: 14 Japan Pharmaceutical Manufacturing Market Share (%), By Drug Type, 2033
Figure: 15 Japan Pharmaceutical Manufacturing Market, By Formulation, CAGR (%), 2024-2033
Figure: 16 Japan Pharmaceutical Manufacturing Market Share (%), By Formulation, 2024
Figure: 17 Japan Pharmaceutical Manufacturing Market Share (%), By Formulation, 2033
Figure: 18 Japan Pharmaceutical Manufacturing Market, By Route of Administration, CAGR (%), 2024-2033
Figure: 19 Japan Pharmaceutical Manufacturing Market Share (%), By Route of Administration, 2024
Figure: 20 Japan Pharmaceutical Manufacturing Market Share (%), By Route of Administration, 2033
Figure: 21 Japan Pharmaceutical Manufacturing Market, By Therapeutic Application, CAGR (%), 2024-2033
Figure: 22 Japan Pharmaceutical Manufacturing Market Share (%), By Therapeutic Application, 2024
Figure: 23 Japan Pharmaceutical Manufacturing Market Share (%), By Therapeutic Application, 2033
Figure: 24 Japan Pharmaceutical Manufacturing Market, By Manufacturing Facility, CAGR (%), 2024-2033
Figure: 25 Japan Pharmaceutical Manufacturing Market Share (%), By Manufacturing Facility, 2024
Figure: 26 Japan Pharmaceutical Manufacturing Market Share (%), By Manufacturing Facility, 2033
Figure: 27 Japan Pharmaceutical Manufacturing Market, By Distribution Channel, CAGR (%), 2024-2033
Figure: 28 Japan Pharmaceutical Manufacturing Market Share (%), By Distribution Channel, 2024
Figure: 29 Japan Pharmaceutical Manufacturing Market Share (%), By Distribution Channel, 2033
Figure: 30 Takeda Pharmaceutical Company Limited: Business Revenue Segmentation, 2024
Figure: 31 Takeda Pharmaceutical Company Limited: Geographical Revenue Segmentation, 2024
Figure: 32 Daiichi Sankyo Company, Limited: Business Revenue Segmentation, 2024
Figure: 33 Chugai Pharmaceutical Co., Ltd: Business Revenue Segmentation, 2024
Figure: 34 Chugai Pharmaceutical Co., Ltd: Geographical Revenue Segmentation, 2024
Figure: 35 Astellas Pharma Inc.: Geographical Revenue Segmentation, 2024
Figure: 36 Abbott Laboratories: Business Revenue Segmentation, 2024
Figure: 37 Abbott Laboratories: Geographical Revenue Segmentation, 2024
Figure: 38 AbbVie Inc.: Business Revenue Segmentation, 2024
Figure: 39 AbbVie Inc.: Geographical Revenue Segmentation, 2024
Figure: 40 Aenova Group GmbH: Business Revenue Segmentation, 2024
Figure: 41 Aenova Group GmbH: Geographical Revenue Segmentation, 2024
Figure: 42 Amgen Inc.: Business Revenue Segmentation, 2024
Figure: 43 Amgen Inc.: Geographical Revenue Segmentation, 2024
Figure: 44 AstraZeneca plc: Business Revenue Segmentation, 2024
Figure: 45 AstraZeneca plc: Geographical Revenue Segmentation, 2024
Figure: 46 Bayer AG: Business Revenue Segmentation, 2024
Figure: 47 Bayer AG: Geographical Revenue Segmentation, 2024
Figure: 48 Biogen Inc.: Business Revenue Segmentation, 2024
Figure: 49 Biogen Inc.: Geographical Revenue Segmentation, 2024
Figure: 50 Boehringer Ingelheim International GmbH: Business Revenue Segmentation, 2024
Figure: 51 Boehringer Ingelheim International GmbH: Geographical Revenue Segmentation, 2024
Figure: 52 Eli Lilly and Company: Business Revenue Segmentation, 2024
Figure: 53 Eli Lilly and Company: Geographical Revenue Segmentation, 2024
Figure: 54 F. Hoffmann-La Roche AG: Business Revenue Segmentation, 2024
Figure: 55 F. Hoffmann-La Roche AG: Geographical Revenue Segmentation, 2024
Figure: 56 GSK plc: Business Revenue Segmentation, 2024
Figure: 57 GSK plc: Geographical Revenue Segmentation, 2024
Figure: 58 Merck KgaA: Business Revenue Segmentation, 2024
Figure: 59 Merck KgaA: Geographical Revenue Segmentation, 2024
Figure: 60 Novartis AG: Business Revenue Segmentation, 2024
Figure: 61 Novartis AG: Geographical Revenue Segmentation, 2024
Figure: 62 Novo Nordisk A/S: Business Revenue Segmentation, 2024
Figure: 63 Novo Nordisk A/S: Geographical Revenue Segmentation, 2024
Figure: 64 Pfizer Inc.: Business Revenue Segmentation, 2024
Figure: 65 Pfizer Inc.: Geographical Revenue Segmentation, 2024
Figure: 66 Sanofi SA: Business Revenue Segmentation, 2024
Figure: 67 Sanofi SA: Geographical Revenue Segmentation, 2024


Choose License Type


Features | Type of License | ||||
Data Book | Single User |   Multi User | Corporate | ||
| e-Access | ✓ | ✓ | ✓ | ✓ | |
User Sharing | 1 User Only | 1 User Only | Up to 7 Users | Unlimited User Access | |
⨉ | ⨉ | ⨉ | ✓ | ||
Free Customization | No Free Customization | Up To 30 hrs work | Up To 60 hrs work | Up To 80 hrs work | |
Deliverable |
| ⨉ | ✓ | ✓ | ✓ |
| ✓ | ⨉ | ✓ | ✓ | |
| ⨉ | ⨉ | ⨉ | ✓ | |
Analyst Support | 2-Months Analyst Support | 4-Months Analyst Support | 7-Months Analyst Support | One Year Analyst Support | |
Free Report update in next update cycle | ⨉ | ⨉ | ⨉ | ✓ | |
Free Industry Update (Within 180 days) | ⨉ | ⨉ | ⨉ | ✓ | |
Benefit | Up to 10% off on Post Purchase | Up to 20% off on Post Purchase | Up to 30% off on Post Purchase | Up to 40% off on Post Purchase | |