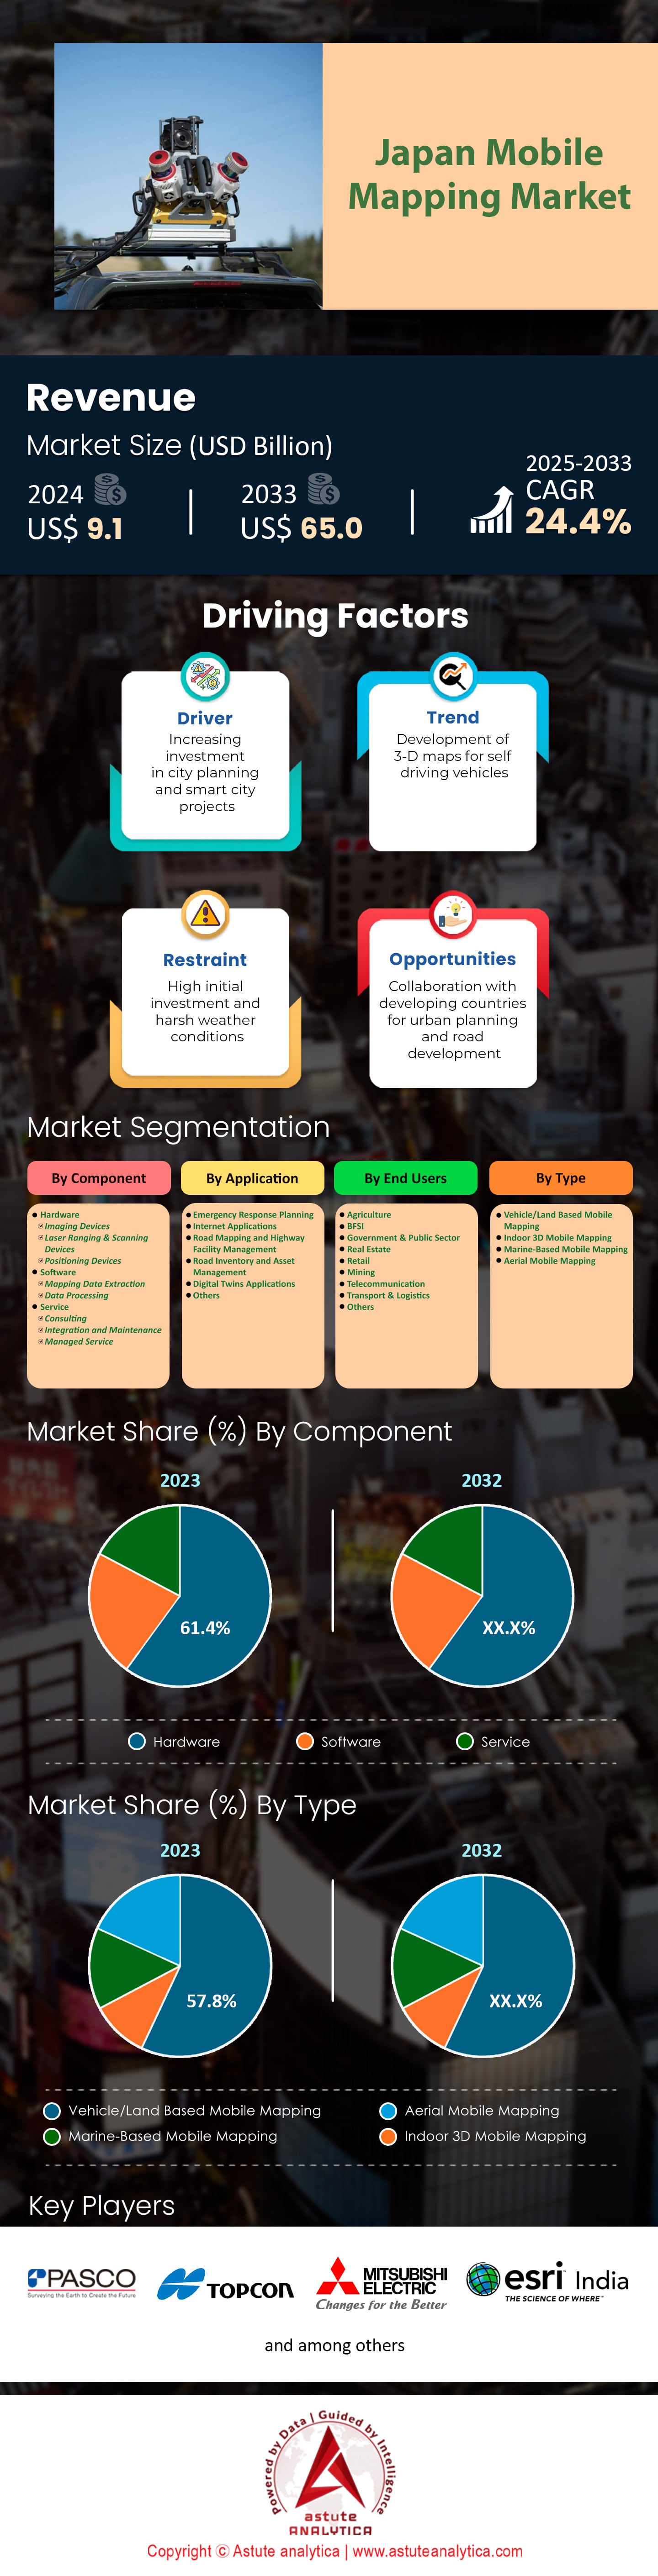
Japan Mobile Mapping Market: Component (Hardware (Imaging Devices, Laser Ranging & Scanning Devices, Positioning Devices), Software (Mapping Data Extraction, Data Processing), Service (Consulting, Integration and Maintenance, and Managed Service); Type (Vehicle/Land Based Mobile Mapping, Indoor 3D Mobile Mapping, Marine-Based Mobile Mapping, Aerial Mobile Mapping); Application (Emergency Response Planning, Internet Applications, Road Mapping and Highway Facility Management, Road Inventory and Asset Management, Digital Twins Applications, Others); End Users (Agriculture, BFSI, Government & Public Sector, Real Estate, Retail, Mining, Telecommunication, Transport & Logistics, Others)—Market Size, Industry Dynamics, Opportunity Analysis and Forecast for 2025–2033
- Last Updated: Dec-2024 | Format:
![pdf]()
![powerpoint]()
![excel]() | Report ID: AA1224997 | Delivery: 2 to 4 Hours
| Report ID: AA1224997 | Delivery: 2 to 4 Hours


 | Report ID: AA1224997 | Delivery: 2 to 4 Hours
 Table 1 Market Dynamics and Trends: Impact Analysis of Market Dynamics
Table 2 Product Price Analysis: Price Analysis
Table 3 Competitive Dashboard: Japan Mobile Mapping Market Competitors Mapping & Benchmarking
Table 4 Japan Mobile Mapping Market Size (US$ Bn), By Component, 2020-2033
Table 5 Japan Mobile Mapping Market Size (US$ Bn), By Type 2020-2033
Table 6 Japan Mobile Mapping Market Size (US$ Bn), By Application 2020-2033
Table 7 Japan Mobile Mapping Market Size (US$ Bn), By End Users 2020-2033
Table 8 Pasco Corporation: Services
Table 9 Pasco Corporation: Recent Developments
Table 10 Esri India Technologies Private Limited : Products
Table 11 Genesys International Corporation : Product
Table 12 McElhanney : Product
Table 13 Mitsubishi Electric Corporation : Product
Table 14 Mitsubishi Electric Corporation: Financial Analysis
Table 15 NV5 Global, Inc. : Product
Table 16 NV5 Global, Inc.: Financial Analysis
Table 17 Timmons Group, Inc. : Product
Table 18 Topcon Corporation : Product
Table 19 Other Prominent Players
Figure 1 Japan Mobile Mapping Market, Revenue (US$ Bn), 2020-2033
Figure 2 Japan Mobile Mapping Market Covid-19 Impact & Recovery, 2020-2033, Y-o-Y (%)
Figure 3 Market Share Analysis, By Company, Based on Revenue (2020)
Figure 4 Japan Mobile Mapping Market Competitors Mapping & Benchmarking
Figure 5 Japan Mobile Mapping Market, By Component, CAGR (%), 2020-2033
Figure 6 Japan Mobile Mapping Market Share (%), By Component, 2020
Figure 7 Japan Mobile Mapping Market Share (%), By Component, 2033
Figure 8 Japan Mobile Mapping Market, By Type, CAGR (%), 2020-2033
Figure 9 Japan Mobile Mapping Market Share (%), By Type, 2020
Figure 10 Japan Mobile Mapping Market Share (%), By Type, 2033
Figure 11 Japan Mobile Mapping Market, By Application, CAGR (%), 2020-2033
Figure 12 Japan Mobile Mapping Market Share (%), By Application, 2020
Figure 13 Japan Mobile Mapping Market Share (%), By Application, 2033
Figure 14 Japan Mobile Mapping Market, By End Users, CAGR (%), 2020-2033
Figure 15 Japan Mobile Mapping Market Share (%), By End Users, 2020
Figure 16 Japan Mobile Mapping Market Share (%), By End Users, 2033
Figure 17 Mitsubishi Electric Corporation: Business Revenue Segmentation, 2020
Figure 18 Mitsubishi Electric Corporation: Geographical Revenue Segmentation, 2020
Figure 19 NV5 Global, Inc. : Business Revenue Segmentation, 2020
Figure 20 NV5 Global, Inc. : Geographical Revenue Segmentation, 2020


Choose License Type


Features | Type of License | ||||
Data Book | Single User |   Multi User | Corporate | ||
| e-Access | ✓ | ✓ | ✓ | ✓ | |
User Sharing | 1 User Only | 1 User Only | Up to 7 Users | Unlimited User Access | |
⨉ | ⨉ | ⨉ | ✓ | ||
Free Customization | No Free Customization | Up To 30 hrs work | Up To 60 hrs work | Up To 80 hrs work | |
Deliverable |
| ⨉ | ✓ | ✓ | ✓ |
| ✓ | ⨉ | ✓ | ✓ | |
| ⨉ | ⨉ | ⨉ | ✓ | |
Analyst Support | 2-Months Analyst Support | 4-Months Analyst Support | 7-Months Analyst Support | One Year Analyst Support | |
Free Report update in next update cycle | ⨉ | ⨉ | ⨉ | ✓ | |
Free Industry Update (Within 180 days) | ⨉ | ⨉ | ⨉ | ✓ | |
Benefit | Up to 10% off on Post Purchase | Up to 20% off on Post Purchase | Up to 30% off on Post Purchase | Up to 40% off on Post Purchase | |