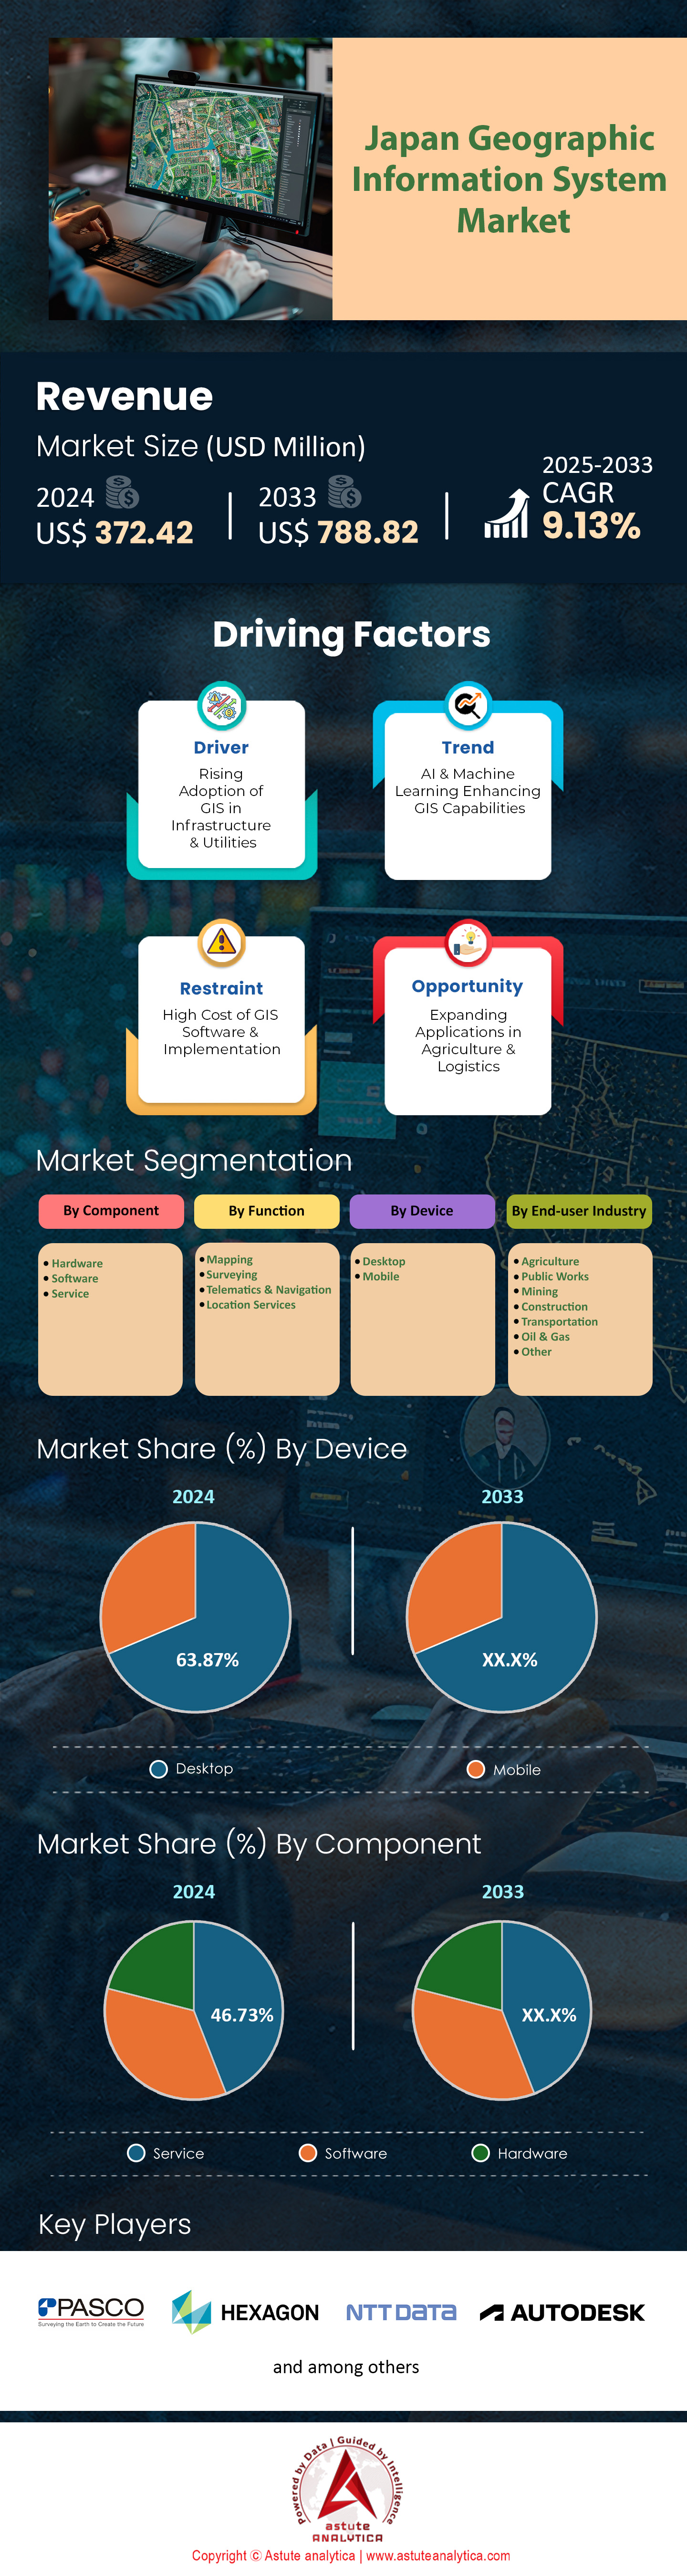
Japan Geographic Information System Market: By Component (Hardware, Software, Service); Function (Mapping, Surveying, Telematics & Navigation, Location Services); Device (Desktop and Mobile); End Use Industry (Agriculture, Public Works, Mining, Construction, Transportation, Oil & Gas, Other); Country—Market Size, Industry Dynamics, Opportunity Analysis and Forecast for 2025–2033
- Last Updated: Mar-2025 | Format:
![pdf]()
![powerpoint]()
![excel]() | Report ID: AA03251229 | Delivery: Immediate Access
| Report ID: AA03251229 | Delivery: Immediate Access


 | Report ID: AA03251229 | Delivery: Immediate Access
 Table: 1 Pestle Impact Analysis : Political Factors
Table: 2 Pestle Impact Analysis : Economic Factors
Table: 3 Pestle Impact Analysis : Social Factors
Table: 4 Pestle Impact Analysis : Technological Factors
Table: 5 Pestle Impact Analysis : Legal Factors
Table: 6 Pestle Impact Analysis : Environmental Factors
Table: 7 Market Dynamics: Restraint : Esri Gis Software Cost
Table: 8 Market Dynamics And Trends: Impact Analysis of Market Dynamics
Table: 9 Product Price Analysis : Gis Software Based Price Analysis
Table: 10 Japan Geographic Information System Market Size (Us$ Mn), By Component, 2020-2033
Table: 11 Japan Geographic Information System Market Size (Us$ Mn), By Function, 2020-2033
Table: 12 Japan Geographic Information System Market Size (Us$ Mn), By Device, 2020-2033
Table: 13 Japan Geographic Information System Market Size (Us$ Mn), By End-User Industry, 2020-2033
Table: 14 Japan Geographic Information System Market Size (Us$ Mn), By Region, 2020-2033
Table: 15 Esri : Offering
Table: 16 Hexagon Ab : Recent Developments
Table: 17 Hexagon Ab : Offering
Table: 18 Hexagon Ab: Financial Analysis
Table: 19 Autodesk, Inc. : Offering
Table: 20 Autodesk, Inc.: Financial Analysis
Table: 21 Pasco Corporation : Offering
Table: 22 Pasco Corporation: Financial Analysis
Table: 23 Ntt Data, Inc.: Offering
Table: 24 Ntt Data, Inc.: Financial Analysis
Table: 25 Caliper Corporation : Offering
Table: 26 Supermap Software Co., Ltd.: Offering
Table: 27 Zenrin Co., Ltd.: Offering
Table: 28 Zenrin Co., Ltd.: Financial Analysis
Table: 29 Shashin Kagaku Co.,Ltd.: Product
Table: 30 Hitachi, Ltd.: Product
Table: 31 Hitachi, Ltd..: Financial Analysis
Table: 32 Annexure: Secondary Sources
Figure: 1 Executive Summary : Japan Geographic Information System (Gis) Market (US$ Mn), 2020-2033
Figure: 2 Market Dynamics: Driver: Technology mix in Japan
Figure: 3 Market Dynamics: Opportunity: Japan Arable land (Mn Hectares)
Figure: 4 Market Dynamics: Trends: R&D funds spent by Japanese government on AI
Figure: 5 Competitive Dashboard: Market Share Analysis By Company, Based On Revenue (2024)
Figure: 6 Japan Geographic Information System Market, By Component, Cagr (%), 2024-2033
Figure: 7 Japan Geographic Information System Market Share (%), By Component, 2024
Figure: 8 Japan Geographic Information System Market Share (%), By Component, 2033
Figure: 9 Japan Geographic Information System Market, By Function, Cagr (%), 2024-2033
Figure: 10 Japan Geographic Information System Market Share (%), By Function, 2024
Figure: 11 Japan Geographic Information System Market Share (%), By Function, 2033
Figure: 12 Japan Geographic Information System Market, By Device, Cagr (%), 2024-2033
Figure: 13 Japan Geographic Information System Market Share (%), By Device, 2024
Figure: 14 Japan Geographic Information System Market Share (%), By Device, 2033
Figure: 15 Japan Geographic Information System Market, By End-User Industry, Cagr (%), 2024-2033
Figure: 16 Japan Geographic Information System Market Share (%), By End-User Industry, 2024
Figure: 17 Japan Geographic Information System Market Share (%), By End-User Industry, 2033
Figure: 18 Japan Geographic Information System Market, By Region, Cagr (%), 2024-2033
Figure: 19 Japan Geographic Information System Market Share (%), Region, 2024
Figure: 20 Japan Geographic Information System Market Share (%), By Region, 2033
Figure: 21 Hexagon AB: Business Area Segmentation, 2024
Figure: 22 Hexagon AB: Geographical Revenue Segmentation, 2024
Figure: 23 Autodesk, Inc.: Business Area Segmentation, 2024
Figure: 24 Autodesk, Inc.: Geographical Revenue Segmentation, 2024
Figure: 25 NTT DATA, Inc.: Geographical Revenue Segmentation, 2024
Figure: 26 Zenrin Co., Ltd.: Business Area Segmentation, 2024
Figure: 27 Hitachi, Ltd.: Business Area Segmentation, 2024
Figure: 28 Hitachi, Ltd.: Geographical Revenue Segmentation, 2024


Choose License Type


Features | Type of License | ||||
Data Book | Single User |   Multi User | Corporate | ||
| e-Access | ✓ | ✓ | ✓ | ✓ | |
User Sharing | 1 User Only | 1 User Only | Up to 7 Users | Unlimited User Access | |
⨉ | ⨉ | ⨉ | ✓ | ||
Free Customization | No Free Customization | Up To 30 hrs work | Up To 60 hrs work | Up To 80 hrs work | |
Deliverable |
| ⨉ | ✓ | ✓ | ✓ |
| ✓ | ⨉ | ✓ | ✓ | |
| ⨉ | ⨉ | ⨉ | ✓ | |
Analyst Support | 2-Months Analyst Support | 4-Months Analyst Support | 7-Months Analyst Support | One Year Analyst Support | |
Free Report update in next update cycle | ⨉ | ⨉ | ⨉ | ✓ | |
Free Industry Update (Within 180 days) | ⨉ | ⨉ | ⨉ | ✓ | |
Benefit | Up to 10% off on Post Purchase | Up to 20% off on Post Purchase | Up to 30% off on Post Purchase | Up to 40% off on Post Purchase | |