Japan Epoxy Resins Market: By Type (DGBEA (Bisphenol A and ECH), DGBEF (Bisphenol F and ECH), Novolac (Formaldehyde and Phenols), and Others); Form (Liquid, Solid, and Solution); Application (Paints & Coatings, Composites, Adhesives & Sealants, and Others); End Users (Building & Construction, Aerospace, Consumer Goods, and Others)—Industry Dynamics, Market Size and Opportunity Forecast for 2024–2032
- Last Updated: Nov-2024 | Format:
![pdf]()
![powerpoint]()
![excel]() | Report ID: AA0422199 | Delivery: 2 to 4 Hours
| Report ID: AA0422199 | Delivery: 2 to 4 Hours


 | Report ID: AA0422199 | Delivery: 2 to 4 Hours
 Table 1.Application Analysis – Top Customers in Japan
Table 2.Top customers across Aerospace industry in Japan
Table 3.Top customers across Building & Construction industry in Japan
Table 4.Top customers across Marine industry in Japan
Table 5.Top customers across Consumer Goods industry in Japan
Table 6.Top customers across Wind Power industry in Japan
Table 7.Top Players Across End-User Segments in Japan Epoxy Resins Market
Table 8.Japan Epoxy Resin Market Size (Kilo Tons), by Value, by Type, 2019-2032
Table 9.Japan Epoxy Resin Market Size (US$ Mn), by Value, by Type, 2019-2032
Table 10.Japan Epoxy Resin Market Size (US$ Mn), by Value, by Form, 2019-2032
Table 11.Japan Epoxy Resin Market Volume (Kilo Tons), by Value, by Form, 2019-2032
Table 12.Japan Epoxy Resin Market Size (US$ Mn), by Value, by Application, 2019-2032
Table 13.Japan Epoxy Resin Market Volume (Kilo Tons), by Value, by Application, 2019-2032
Table 14.Japan Epoxy Resin Market Size (US$ Mn), by Value, by End User, 2019-2032
Table 15.Japan Epoxy Resin Market Volume (Kilo Tons), by Value, by End User, 2019-2032
Table 16.3M: Financial Analysis
Table 17.Arkema: Financial Analysis
Table 18.DuPont de Nemours inc.: Financial Analysis
Table 19.Huntsman international LLC: Financial Analysis
Table 20.BASF SE: Financial Analysis
Table 21.Evonik industries AG: Financial Analysis
Table 22.Aditya Birla Chemicals: Financial Analysis
Table 23.Covestro AG: Financial Analysis
Table 24.Kukdo Chemical Co. Ltd.: Financial Analysis
Table 25.Olin Corporation: Financial Analysis
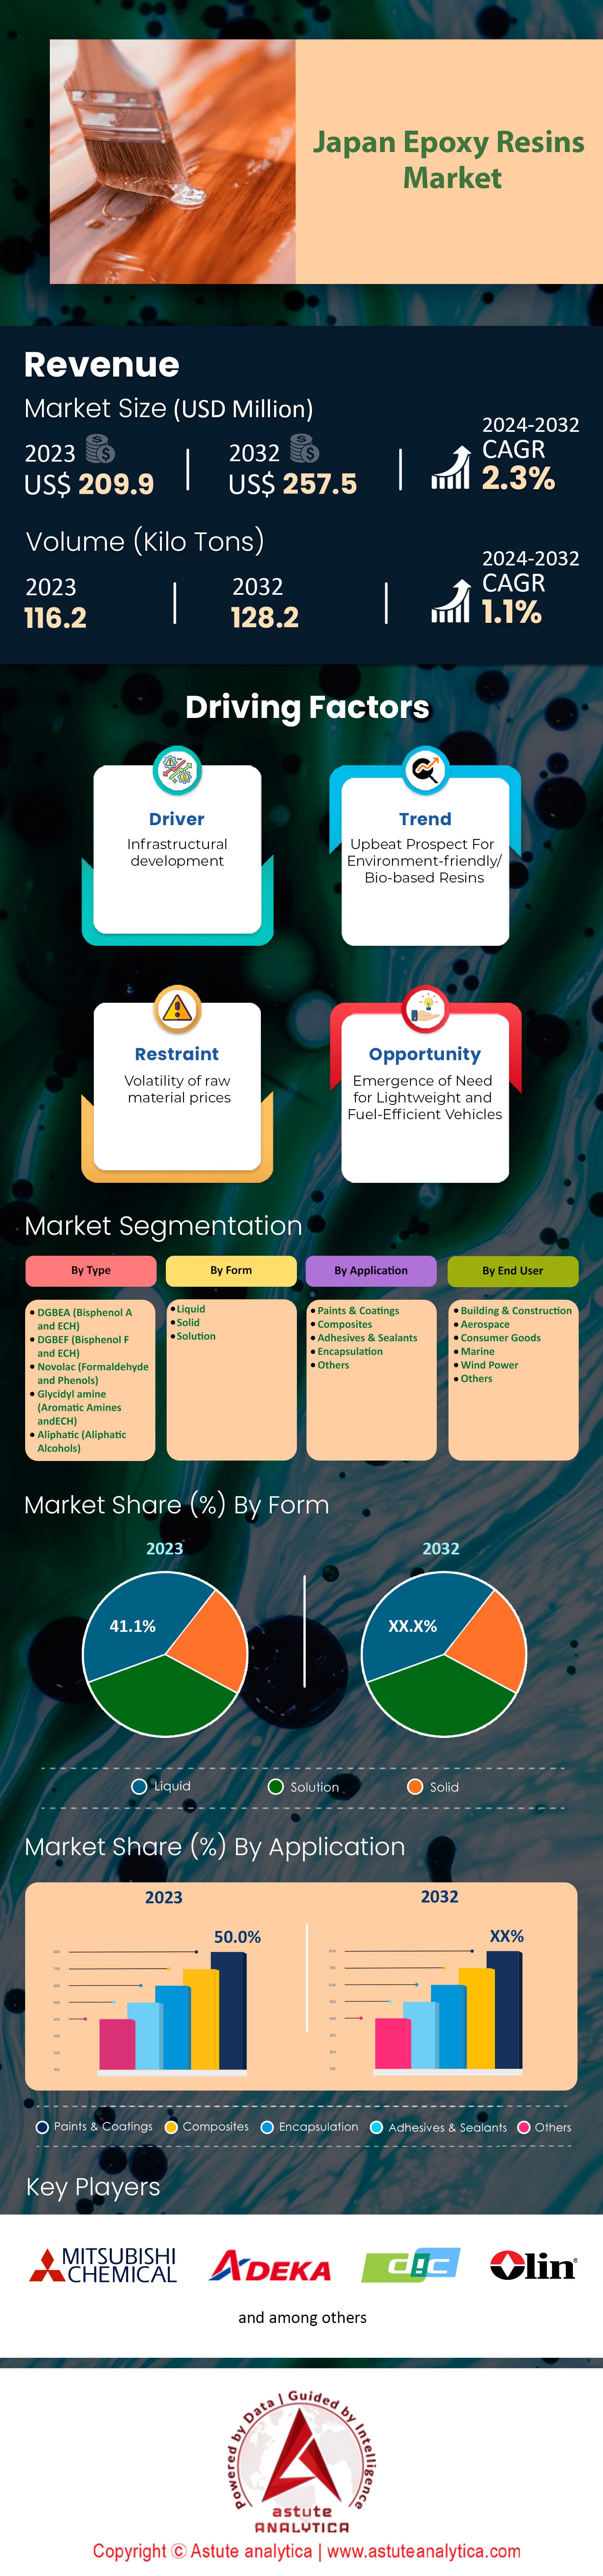
Figure 1:Japan Epoxy Resin Market Size, By Value, 2023-2032 (US$ Million)
Figure 2:Japan Epoxy Resin Market Size, By YoY Growth, 2023-2032 (%)
Figure 3:Infrastructure investment in Japan (2000-2019)
Figure 4:COVID-19 Impact Assessment on Market Growth Trend
Figure 5:Market Share Analysis, 2023
Figure 6:Global Market Timeseries Analysis
Figure 7:Product Price Analysis, 2023 (Average Pricing, in US$ Per Kilo Tons)
Figure 8:Global Market Volume Estimates and Forecast (Kilo Tons), 2017 – 2032
Figure 9:Japan Epoxy Resins Market, By Type, CAGR (%), 2023-2032
Figure 10:Japan Epoxy Resin Market Share (%), by Value, by Type, 2023
Figure 11:Japan Epoxy Resin Market Share (%), by Value, by Type, 2032
Figure 12:Japan Epoxy Resins Market, By Form, CAGR (%), 2023-2032
Figure 13:Japan Epoxy Resin Market Share (%), by Value, by Form, 2023
Figure 14:Japan Epoxy Resin Market Share (%), by Value, by Form 2032
Figure 15:Japan Epoxy Resins Market, By Application, CAGR (%), 2023-2032
Figure 16:Japan Epoxy Resin Market Share (%), by Value, by Application, 2023
Figure 17:Japan Epoxy Resin Market Share (%), by Value, by Application, 2032
Figure 18:Japan Epoxy Resins Market, By End-Use, CAGR (%), 2023-2032
Figure 19:Japan Epoxy Resin Market Share (%), by Value, by End User, 2023
Figure 20:Japan Epoxy Resin Market Share (%), by Value, by End User, 2032
Figure 21:3M: Business Revenue Segmentation, 2023
Figure 22:3M: Geographical Revenue Segmentation, 2023
Figure 23:Arkema: Business Revenue Segmentation, 2023
Figure 24:Arkema: Geographical Revenue Segmentation, 2023
Figure 25:DuPont de Nemours inc.: Business Revenue Segmentation, 2023
Figure 26:DuPont de Nemours inc.: Geographical Revenue Segmentation, 2023
Figure 27:Huntsman international LLC: Business Revenue Segmentation, 2023
Figure 28:Huntsman international LLC: Geographical Revenue Segmentation, 2023
Figure 29:BASF SE: Business Revenue Segmentation, 2023
Figure 30:BASF SE: Geographical Revenue Segmentation, 2023
Figure 31:Evonik industries AG: Business Revenue Segmentation, 2023
Figure 32:Evonik industries AG: Geographical Revenue Segmentation, 2023
Figure 33:Aditya Birla Chemicals: Business Revenue Segmentation, 2023
Figure 34:Aditya Birla Chemicals: Geographical Revenue Segmentation, 2023
Figure 35:Covestro AG: Business Revenue Segmentation, 2023
Figure 36:Covestro AG: Geographical Revenue Segmentation, 2023
Figure 37:Olin Corporation: Business Revenue Segmentation, 2023
Figure 38:Olin Corporation: Geographical Revenue Segmentation, 2023


Choose License Type


Features | Type of License | ||||
Data Book | Single User |   Multi User | Corporate | ||
| e-Access | ✓ | ✓ | ✓ | ✓ | |
User Sharing | 1 User Only | 1 User Only | Up to 7 Users | Unlimited User Access | |
⨉ | ⨉ | ⨉ | ✓ | ||
Free Customization | No Free Customization | Up To 30 hrs work | Up To 60 hrs work | Up To 80 hrs work | |
Deliverable |
| ⨉ | ✓ | ✓ | ✓ |
| ✓ | ⨉ | ✓ | ✓ | |
| ⨉ | ⨉ | ⨉ | ✓ | |
Analyst Support | 2-Months Analyst Support | 4-Months Analyst Support | 7-Months Analyst Support | One Year Analyst Support | |
Free Report update in next update cycle | ⨉ | ⨉ | ⨉ | ✓ | |
Free Industry Update (Within 180 days) | ⨉ | ⨉ | ⨉ | ✓ | |
Benefit | Up to 10% off on Post Purchase | Up to 20% off on Post Purchase | Up to 30% off on Post Purchase | Up to 40% off on Post Purchase | |