Japan Data Center Market: By Component (Hardware (Servers (Blade servers, Rack servers, Tower servers, Micro servers), Storage Systems (Storage Area Network (SAN), Network-Attached Storage (NAS), Direct-Attached Storage (DAS), Cloud storage), Power and Cooling Systems (Power Supply (Uninterruptible Power Supply (UPS) systems, Generators, Power distribution units (PDUs)), Cooling Solutions (Air conditioning units, Liquid Cooling Systems, Advanced Cooling Technologies), Racks and Enclosures (Open frame racks, Enclosed Racks, Customized Enclosures), Software (Data Centre Management Software, Virtualization Software, Security Software), Services (Professional & Managed and Training & Support)); Data Center Type (Colocation, Hyperscale, Edge, Cloud- Based, Enterprise, Managed); Tier Standard (Tier 1, Tier 2, Tier 3, Tier 4); Enterprise Size (Small and Medium-Sized Enterprises (SMEs) and Large Enterprises); Industry (Banking, Financial Services, and Insurance (BFSI), IT and Telecom, Government and Defense, Healthcare, Energy, Manufacturing, Retail, Media and Entertainment, Others (education, transportation, etc.))—Market Size, Industry Dynamics, Opportunity Analysis and Forecast for 2024–2035
- Last Updated: Nov-2024 | Format:
![pdf]()
![powerpoint]()
![excel]() | Report ID: AA1124983 | Delivery: Immediate Access
| Report ID: AA1124983 | Delivery: Immediate Access


 | Report ID: AA1124983 | Delivery: Immediate Access
 Table: 1 PESTLE Impact Analysis : Political Factors
Table: 2 PESTLE Impact Analysis : Economic Factors
Table: 3 PESTLE Impact Analysis : Social Factors
Table: 4 PESTLE Impact Analysis : Technological Factors
Table: 5 PESTLE Impact Analysis : Environmental Factors
Table: 6 PESTLE Impact Analysis : Legal Factors
Table: 7 Trend : Favorable Government Initiatives
Table: 8 Market Dynamics And Trends : Impact Analysis Of Market Dynamics
Table: 9 Competitive Dashboard : Competitor Mapping & Benchmarking
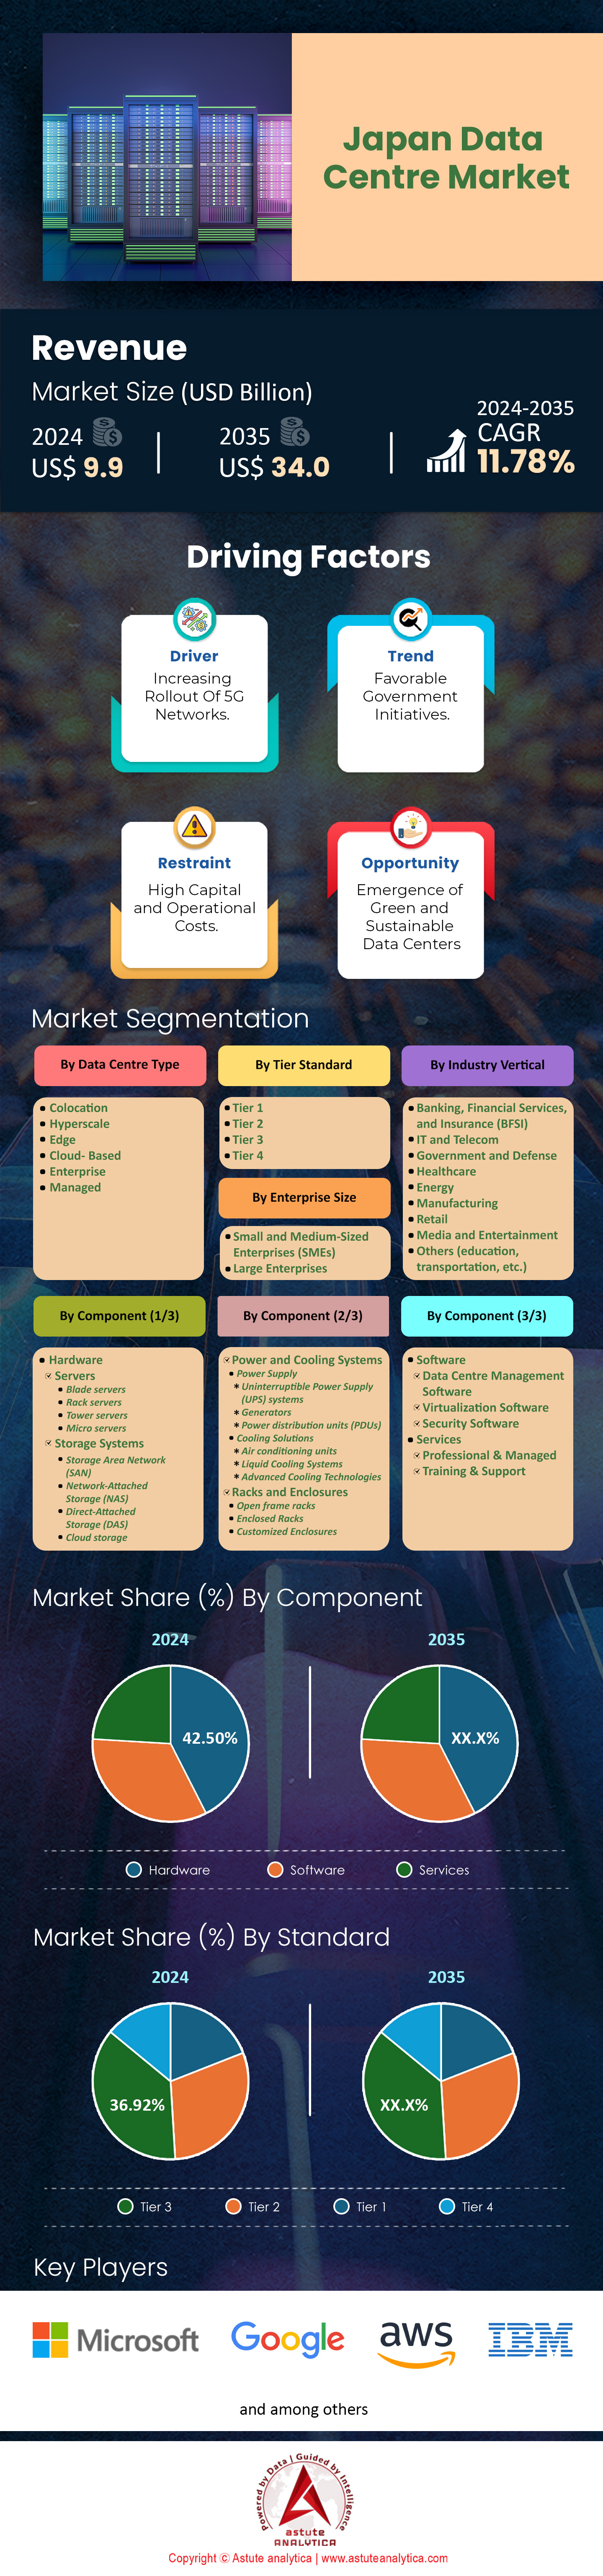
Table: 10 Japan Data Center Market Size (Us$ Bn), By Component, 2020-2035
Table: 11 Japan Data Center Market Size (Us$ Bn), By Data Center Type, 2020-2035
Table: 12 Japan Data Center Market Size (Us$ Bn), By Tier Standard, 2020-2035
Table: 13 Japan Data Center Market Size (Us$ Bn), By Enterprise Size, 2020-2035
Table: 14 Japan Data Center Market Size (Us$ Bn), By Industry Vertical, 2020-2035
Table: 15 Amazon Web Services : Recent Developments
Table: 16 Amazon Web Services : Products
Table: 17 Amazon.Com, Inc.(Parent Organization).: Financial Analysis
Table: 18 Cisco Systems, Inc.: Recent Developments
Table: 19 Cisco Systems, Inc.: Offerings
Table: 20 Cisco Systems, Inc.: Financial Analysis
Table: 21 Google Llc : Recent Developments
Table: 22 Google Llc : Offerings
Table: 23 Alphabet Inc. (Parent Organization).: Financial Analysis
Table: 24 Hewlett Packard Enterprise Development Lp : Offering
Table: 25 Hewlett Packard Enterprise Development Lp.: Financial Analysis
Table: 26 Oracle Corporation : Recent Developments
Table: 27 Oracle Corporation : Offering
Table: 28 Oracle Corporation.: Financial Analysis
Table: 29 N+One Data Centers : Offerings
Table: 30 Ntt Data, Inc. : Recent Developments
Table: 31 Ntt Data, Inc. : Offering
Table: 32 Ntt Data, Inc.: Financial Analysis
Table: 33 Ibm Corporation : Recent Developments
Table: 34 Ibm Corporation : Offering
Table: 35 Ibm Corporation: Financial Analysis
Table: 36 Microsoft Corporation : Recent Developments
Table: 37 Microsoft Corporation : Offering
Table: 38 Microsoft Corporation: Financial Analysis
Table: 39 Equinix, Inc.: Recent Developments
Table: 40 Equinix, Inc.: Offering
Table: 41 Equinix, Inc.: Financial Analysis
Table: 42 Dell, Inc. : Offering
Table: 43 Dell, Inc.: Financial Analysis
Table: 44 Sap Se : Offering
Table: 45 Sap Se.: Financial Analysis
Table: 46 Other Prominent Players
Table: 47 Annexure : Secondary Sources
Figure: 1 Executive Summary : Japan Data Centre Market Size And Forecast, 2020-2035 (US$ Bn)
Figure: 2 Executive Summary : Top Segments, CAGR % (2024-2035)
Figure: 3 Industry Outlook : Number Of Data Centers – By Country
Figure: 4 Industry Outlook : Number Of Data Centers – By Region
Figure: 5 Industry Outlook : Share Of People Who Use The Internet In Japan (%)
Figure: 6 Industry Outlook : Japan’s Total Data Centres – By City (2024)
Figure: 7 Industry Outlook : Number Of Data Centers In Asia Pacific, By Country
Figure: 8 Driver : Japan Cloud Market Growth (In US$ Billion)
Figure: 9 Driver : Businesses Using Cloud Services In Japan – In % (2024)
Figure: 10 Driver : Number Of Overall 5G Base Stations In Japan - 2020 To 2024
Figure: 11 Driver : Monthly 5G Availability (% Of Time) – Japan
Figure: 12 Trend : Japan Daily Average Of Cyber Attacks Detected
Figure: 13 Covid -19 Impact & Recovery : Japan Data Centre Market, Covid-19 Impact & Recovery, By Y-O-Y (%), 2020-2035
Figure: 14 Competitive Dashboard : Market Share Analysis By Company, Based On Revenue (2024)
Figure: 15 Japan Data Centre Market, By Component, CAGR (%), 2024-2035
Figure: 16 Japan Data Centre Market Share (%), By Component, 2024
Figure: 17 Japan Data Centre Market Share (%), By Component, 2035
Figure: 18 Japan Data Centre Market, By Data Centre Type, CAGR (%), 2024-2035
Figure: 19 Japan Data Centre Market Share (%), By Data Centre Type, 2024
Figure: 20 Japan Data Centre Market Share (%), By Data Centre Type, 2035
Figure: 21 Japan Data Centre Market, By Tier Standard, CAGR (%), 2024-2035
Figure: 22 Japan Data Centre Market Share (%), By Tier Standard, 2024
Figure: 23 Japan Data Centre Market Share (%), By Tier Standard, 2035
Figure: 24 Japan Data Centre Market, By Enterprise Size, CAGR (%), 2024-2035
Figure: 25 Japan Data Centre Market Share (%), By Enterprise Size, 2024
Figure: 26 Japan Data Centre Market Share (%), By Enterprise Size, 2035
Figure: 27 Japan Data Centre Market, By Industry Vertical, CAGR (%), 2024-2035
Figure: 28 Japan Data Centre Market Share (%), By Industry Vertical, 2024
Figure: 29 Japan Data Centre Market Share (%), By Industry Vertical, 2035
Figure: 30 Amazon Web Services : Business Revenue Segmentation, 2024
Figure: 31 Amazon Web Services : Geographical Revenue Segmentation, 2024
Figure: 32 Cisco Systems, Inc. : Business Revenue Segmentation, 2024
Figure: 33 Cisco Systems, Inc. : Geographical Revenue Segmentation, 2024
Figure: 34 Google LLC : Business Revenue Segmentation, 2024
Figure: 35 Google LLC : Geographical Revenue Segmentation, 2024
Figure: 36 Hewlett Packard Enterprise Development LP : Business Revenue Segmentation, 2024
Figure: 37 Hewlett Packard Enterprise Development LP : Geographical Revenue Segmentation, 2024
Figure: 38 Oracle Corporation : Business Revenue Segmentation, 2024
Figure: 39 Oracle Corporation : Geographical Revenue Segmentation, 2024
Figure: 40 NTT DATA, Inc.: Geographical Revenue Segmentation, 2024
Figure: 41 IBM Corporation : Business Revenue Segmentation, 2024
Figure: 42 IBM Corporation : Geographical Revenue Segmentation, 2024
Figure: 43 Microsoft Corporation : Business Revenue Segmentation, 2024
Figure: 44 Microsoft Corporation : Geographical Revenue Segmentation, 2024
Figure: 45 Equinix, Inc.: Business Revenue Segmentation, 2024
Figure: 46 Equinix, Inc. : Geographical Revenue Segmentation, 2024
Figure: 47 Dell, Inc. : Business Revenue Segmentation, 2024
Figure: 48 Dell, Inc. : Geographical Revenue Segmentation, 2024
Figure: 49 SAP SE : Business Revenue Segmentation, 2024
Figure: 50 SAP SE : Geographical Revenue Segmentation, 2024


Choose License Type


Features | Type of License | ||||
Data Book | Single User |   Multi User | Corporate | ||
| e-Access | ✓ | ✓ | ✓ | ✓ | |
User Sharing | 1 User Only | 1 User Only | Up to 7 Users | Unlimited User Access | |
⨉ | ⨉ | ⨉ | ✓ | ||
Free Customization | No Free Customization | Up To 30 hrs work | Up To 60 hrs work | Up To 80 hrs work | |
Deliverable |
| ⨉ | ✓ | ✓ | ✓ |
| ✓ | ⨉ | ✓ | ✓ | |
| ⨉ | ⨉ | ⨉ | ✓ | |
Analyst Support | 2-Months Analyst Support | 4-Months Analyst Support | 7-Months Analyst Support | One Year Analyst Support | |
Free Report update in next update cycle | ⨉ | ⨉ | ⨉ | ✓ | |
Free Industry Update (Within 180 days) | ⨉ | ⨉ | ⨉ | ✓ | |
Benefit | Up to 10% off on Post Purchase | Up to 20% off on Post Purchase | Up to 30% off on Post Purchase | Up to 40% off on Post Purchase | |