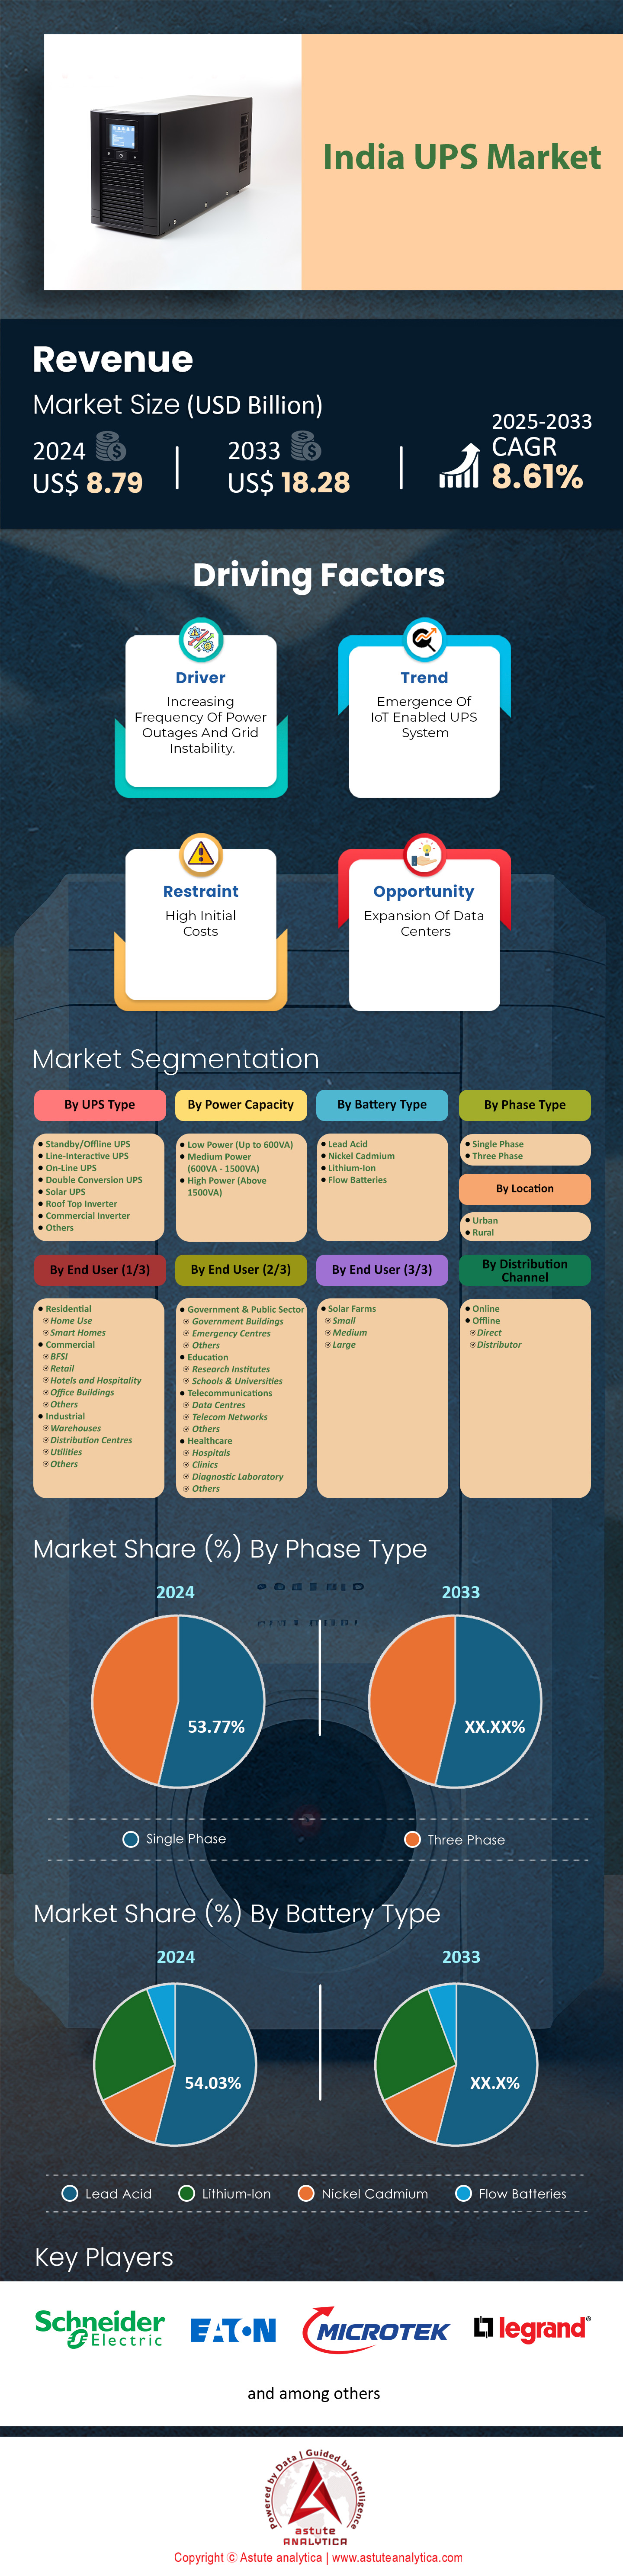
India UPS Market: By UPS Type (Standby/Offline UPS, Line-Interactive UPS, On-Line UPS, Double Conversion UPS, Solar UPS, Roof Top Inverter, Commercial Inverter, Others); Power Capacity (Low Power (Up to 600VA), Medium Power (600VA - 1500VA), High Power (Above 1500VA)); Phase Type (Single Phase and Three Phase); Battery Type (Lead Acid, Nickel Cadmium, Lithium-Ion and Flow Batteries); Location (Urban and Rural); End Users (Residential (Home Use, Smart Homes), Commercial (BFSI, Retail, Hotels and Hospitality, Office Buildings, Others); Industrial (Warehouses, Distribution Centres, Utilities, Others), Government & Public Sector (Government Buildings, Emergency Centres, Others), Education (Research Institutes, Schools & Universities), Telecommunications (Data Centres, Telecom Networks, Others), Healthcare (Hospitals, Clinics, Diagnostic Laboratory, Others); Country—Market Size, Industry Dynamics, Opportunity Analysis and Forecast for 2025–2033
- Last Updated: Mar-2025 | Format:
![pdf]()
![powerpoint]()
![excel]() | Report ID: AA03251217 | Delivery: Immediate Access
| Report ID: AA03251217 | Delivery: Immediate Access


 | Report ID: AA03251217 | Delivery: Immediate Access
 Table 1 Industry Outlook: Overview of Technology in Indian UPS Systems Industry
Table 2 Industry Outlook: Overview of Uninterruptible Power Supply Trends
Table 3 Industry Outlook: Growth Of Total Electricity Consumption (GWh) By Ultimate Consumers - State Wise (2022-2023)
Table 4 Industry Outlook: Growth Of Total Electricity Consumption (GWh) By Ultimate Consumers - State Wise
Table 5 Industry Outlook: Region Wise Concentration of Key Players – India, Based on Location
Table 6 Industry Outlook: Overview of UPS Inverter Design Updates
Table 7 Industry Outlook: Semiconductor Imports in India – 2023
Table 8 India UPS Semiconductor Market Size (US$ Bn), By Semiconductor Type, 2020-2033
Table 9 India UPS Semiconductor Market Size (US$ Bn), By Material, 2020-2033
Table 10 India UPS Semiconductor Market Size (US$ Bn), By Application, 2020-2033
Table 11 Pestle Impact Analysis: Political Factors
Table 12 Pestle Impact Analysis Economic Factors
Table 13 Pestle Impact Analysis Social Factors
Table 14 Technological Factors
Table 15 Pestle Impact Analysis Environmental Factors
Table 16 Pestle Impact Analysis Legal Factors
Table 17 Driver: State/Ut-Wise Details Of Solar Potential (2024)
Table 18 Opportunity: Data Centers Demand And Supply In India - 2022
Table 19 Product Price Analysis: Product-Based Price Analysis (In Us$/ Unit)
Table 20 India UPS Market Size (US$ Bn), By UPS Type, 2020-2033
Table 21 India UPS Market Size (Thousand Units), By UPS Type, 2020-2033
Table 22 India UPS Market Size (US$ Bn), By Power Capacity, 2020-2033
Table 23 India UPS Market Size (Thousand Units), By Power Capacity, 2020-2033
Table 24 India UPS Market Size (US$ Bn), By Phase Type, 2020-2033
Table 25 India UPS Market Size (Thousand Units), By Phase Type, 2020-2033
Table 26 India UPS Market Size (US$ Bn), By Battery Type, 2020-2033
Table 27 India UPS Market Size (Thousand Units), By Battery Type, 2020-2033
Table 28 India UPS Market Size (US$ Bn), By Location, 2020-2033
Table 29 India UPS Market Size (Thousand Units), By Location, 2020-2033
Table 30 India UPS Market Size (US$ Bn), By End User, 2020-2033
Table 31 India UPS Market Size (Thousand Units), By End User, 2020-2033
Table 32 India UPS Market Size (US$ Bn), By Distribution Channel, 2020-2033
Table 33 India UPS Market Size (Thousand Units), By Distribution Channel, 2020-2033
Table 34 ABB Ltd.: Recent Developments
Table 35 ABB Ltd.: Product
Table 36 ABB Ltd: Financial Analysis
Table 37 Cyber Power Systems, Inc.: Recent Developments
Table 38 Cyber Power Systems, Inc.: Product
Table 39 Cyber Power Systems, Inc.: Sales Contribution of Exports and Domestic Sales for UPS
Table 40 Cyber Power Systems, Inc.: Level of Localization in UPS Products
Table 41 Cyber Power Systems, Inc.: Components/Activities are Procured Locally vs Imported
Table 42 Cyber Power Systems, Inc.: Approximate Cost Breakdown (assuming for a 1kVA UPS)
Table 43 Cyber Power Systems, Inc.: Cost Breakdown for Semiconductor Materials in an UPS (assuming for a 1kVA UPS)
Table 44 Cyber Power Systems, Inc.: Cost Breakdown for Semiconductor Devices (MOSFET, IGBT, Microcontroller, Coupler, Diode, etc) in an UPS (assuming for a 1kVA UPS)
Table 45 Cyber Power Systems, Inc.: Cost Breakdown for Semiconductor Devices (MOSFET, IGBT, Microcontroller, Coupler, Diode, etc) in an UPS (assuming for a 1kVA UPS)
Table 46 Cyber Power Systems, Inc.: Financial Analysis
Table 47 Delta Electronics, Inc.: Recent Developments
Table 48 Delta Electronics, Inc.: Product
Table 49 Delta Electronics, Inc.: Financial Analysis
Table 50 Eaton Corporation Plc: Recent Developments
Table 51 Eaton Corporation Plc: Product
Table 52 Eaton Corporation Plc: Sales Contribution of Exports and Domestic Sales for UPS
Table 53 Eaton Corporation Plc: Level of Localization in UPS Products
Table 54 Eaton Corporation Plc: Components/Activities are Procured Locally vs Imported
Table 55 Eaton Corporation Plc: Approximate Cost Breakdown (assuming for a 1kVA UPS)
Table 56 Eaton Corporation Plc: Cost Breakdown for Semiconductor Materials in an UPS (assuming for a 1kVA UPS)
Table 57 Eaton Corporation Plc: Cost Breakdown for Semiconductor Devices (MOSFET, IGBT, Microcontroller, Coupler, Diode, etc) in an UPS (assuming for a 1kVA UPS)
Table 58 Eaton Corporation Plc: Cost Breakdown for Semiconductor Devices (MOSFET, IGBT, Microcontroller, Coupler, Diode, etc) in an UPS (assuming for a 1kVA UPS)
Table 59 Eaton Corporation Plc.: Financial Analysis
Table 60 Emerson Electric Co.: Product
Table 61 Emerson Electric Co..: Financial Analysis
Table 62 EnerSys: Product
Table 63 EnerSys.: Financial Analysis
Table 64 Hitachi, Ltd.: Product
Table 65 Hitachi, Ltd..: Financial Analysis
Table 66 Legrand Group: Product
Table 67 Legrand Group: Sales Contribution of Exports and Domestic Sales for UPS
Table 68 Legrand Group: Level of Localization in UPS Products
Table 69 Legrand Group: Components/Activities are Procured Locally vs Imported
Table 70 Legrand Group: Approximate Cost Breakdown (assuming for a 1kVA UPS)
Table 71 Legrand Group: Cost Breakdown for Semiconductor Materials in an UPS (assuming for a 1kVA UPS)
Table 72 Legrand Group: Cost Breakdown for Semiconductor Devices (MOSFET, IGBT, Microcontroller, Coupler, Diode, etc) in an UPS (assuming for a 1kVA UPS)
Table 73 Legrand Group: Cost Breakdown for Semiconductor Devices (MOSFET, IGBT, Microcontroller, Coupler, Diode, etc) in an UPS (assuming for a 1kVA UPS)
Table 74 Legrand Group: Financial Analysis
Table 75 Luminous Power Technologies: Product
Table 76 Luminous Power Technologies: Sales Contribution of Exports and Domestic Sales for UPS
Table 77 Luminous Power Technologies: Level of Localization in UPS Products
Table 78 Luminous Power Technologies: Components/Activities are Procured Locally vs Imported
Table 79 Luminous Power Technologies: Approximate Cost Breakdown (assuming for a 1kVA UPS)
Table 80 Luminous Power Technologies: Cost Breakdown for Semiconductor Materials in an UPS (assuming for a 1kVA UPS)
Table 81 Luminous Power Technologies: Cost Breakdown for Semiconductor Devices (MOSFET, IGBT, Microcontroller, Coupler, Diode, etc) in an UPS (assuming for a 1kVA UPS)
Table 82 Luminous Power Technologies: Cost Breakdown for Semiconductor Devices (MOSFET, IGBT, Microcontroller, Coupler, Diode, etc) in an UPS (assuming for a 1kVA UPS)
Table 83 Luminous Power Technologies: Schneider Electric SE (Parent Company).: Financial Analysis
Table 84 Microtek International: Product
Table 85 Microtek International.: Financial Analysis
Table 86 Mitsubishi Electric Corporation: Product
Table 87 Mitsubishi Electric Corporation.: Financial Analysis
Table 88 Numeric Power Systems: Product
Table 89 Legrand (Parent Company).: Financial Analysis
Table 90 Riello Elettronica Group: Recent Developments
Table 91 Riello Elettronica Group: Product
Table 92 Riello Elettronica Group: Sales Contribution of Exports and Domestic Sales for UPS
Table 93 Riello Elettronica Group: Level of Localization in UPS Products
Table 94 Riello Elettronica Group: Components/Activities are Procured Locally vs Imported
Table 95 Riello Elettronica Group: Approximate Cost Breakdown (assuming for a 1kVA UPS)
Table 96 Riello Elettronica Group: Cost Breakdown for Semiconductor Materials in an UPS (assuming for a 1kVA UPS)
Table 97 Riello Elettronica Group: Cost Breakdown for Semiconductor Devices (MOSFET, IGBT, Microcontroller, Coupler, Diode, etc) in an UPS (assuming for a 1kVA UPS)
Table 98 Riello Elettronica Group: Cost Breakdown for Semiconductor Devices (MOSFET, IGBT, Microcontroller, Coupler, Diode, etc) in an UPS (assuming for a 1kVA UPS)
Table 99 Schneider Electric SE: Recent Developments
Table 100 Schneider Electric SE: Product
Table 101 Schneider Electric SE: Sales Contribution of Exports and Domestic Sales for UPS
Table 102 Schneider Electric SE: Level of Localization in UPS Products
Table 103 Schneider Electric SE: Components/Activities are Procured Locally vs Imported
Table 104 Schneider Electric SE: Approximate Cost Breakdown (assuming for a 1kVA UPS)
Table 105 Schneider Electric SE: Cost Breakdown for Semiconductor Materials in an UPS (assuming for a 1kVA UPS)
Table 106 Schneider Electric SE: Cost Breakdown for Semiconductor Devices (MOSFET, IGBT, Microcontroller, Coupler, Diode, etc) in an UPS (assuming for a 1kVA UPS)
Table 107 Schneider Electric SE: Cost Breakdown for Semiconductor Devices (MOSFET, IGBT, Microcontroller, Coupler, Diode, etc) in an UPS (assuming for a 1kVA UPS)
Table 108 Schneider Electric SE: Schneider Electric SE.: Financial Analysis
Table 109 Socomec India Private Limited: Recent Developments
Table 110 Socomec India Private Limited: Product
Table 111 Socomec India Private Limited: Sales Contribution of Exports and Domestic Sales for UPS
Table 112 Socomec India Private Limited: Level of Localization in UPS Products
Table 113 Socomec India Private Limited: Components/Activities are Procured Locally vs Imported
Table 114 Socomec India Private Limited: Approximate Cost Breakdown (assuming for a 1kVA UPS)
Table 115 Socomec India Private Limited: Cost Breakdown for Semiconductor Materials in an UPS (assuming for a 1kVA UPS)
Table 116 Socomec India Private Limited: Cost Breakdown for Semiconductor Devices (MOSFET, IGBT, Microcontroller, Coupler, Diode, etc) in an UPS (assuming for a 1kVA UPS)
Table 117 Socomec India Private Limited: Cost Breakdown for Semiconductor Devices (MOSFET, IGBT, Microcontroller, Coupler, Diode, etc) in an UPS (assuming for a 1kVA UPS)
Table 118 Su-Kam Power Systems Ltd: Product
Table 119 Toshiba Corporation: Product
Table 120 Toshiba Corporation: Sales Contribution of Exports and Domestic Sales for UPS
Table 121 Toshiba Corporation: Level of Localization in UPS Products
Table 122 Toshiba Corporation: Components/Activities are Procured Locally vs Imported
Table 123 Toshiba Corporation: Approximate Cost Breakdown (assuming for a 1kVA UPS)
Table 124 Toshiba Corporation: Cost Breakdown for Semiconductor Materials in an UPS (assuming for a 1kVA UPS)
Table 125 Toshiba Corporation: Cost Breakdown for Semiconductor Devices (MOSFET, IGBT, Microcontroller, Coupler, Diode, etc) in an UPS (assuming for a 1kVA UPS)
Table 126 Toshiba Corporation: Cost Breakdown for Semiconductor Devices (MOSFET, IGBT, Microcontroller, Coupler, Diode, etc) in an UPS (assuming for a 1kVA UPS)
Table 127 Toshiba Corporation.: Financial Analysis
Table 128 Zebronics India Pvt. Ltd: Product
Table 129 Other Prominent Players
Table 130 Annexure: Secondary Sources
Figure 1 Executive Summary: India UPS Market Size and Forecast, 2020-2033 (US$ Bn and Thousand Units)
Figure 2 Industry Outlook: Growth Of Total Electricity Consumption (%) By Ultimate Consumers - Region Wise (2022-2024)
Figure 3 Consumer Behavior Analysis: Preferred By Brand
Figure 4 Consumer Behavior Analysis: Preferred By Retail Channel
Figure 5 Consumer Behavior Analysis: Preferred By Income Group
Figure 6 Consumer Behavior Analysis: Preferred By UPS Type
Figure 7 Consumer Behavior Analysis: Preferred By Capacity
Figure 8 Consumer Behavior Analysis: Preferred By Maintenance Frequency
Figure 9 Consumer Behavior Analysis: Preferred By Battery Replacement Frequency
Figure 10 Consumer Behavior Analysis: Preferred By Key Concerns related to UPS
Figure 11 Industry Outlook: Region Wise Concentration of Key Players – India, Based on Location
Figure 12 Industry Outlook: Region Wise Concentration of Key Players – India, Based on Revenue/Turnover
Figure 13 Industry Outlook: Overview of Energy Generation Statistics – India
Figure 14 Adoption Analysis: Adoption Rate (%), By UPS Type
Figure 15 Adoption Analysis: India UPS Market, By Y-o-Y (%), 2020-2033
Figure 16 Adoption Analysis: By Power Capacity, Revenue Comparison (US$ Bn)
Figure 17 Driver: India Sector Wise Distribution Of Installed Grid-interactive Renewable Power Capacity During 2022-23 (In %)
Figure 18 Driver: India’s Installed Capacity of Grid-Interactive Renewable Power During 2021-22 and 2022-23 (In MW)
Figure 19 Driver: Frequency Of Power Outages In Grid-electrified Indian Households (In %), By Region (2021)
Figure 20 Trend: Smart Home – India Revenue (US$ Bn)
Figure 21 Competitive Dashboard: Market Share Analysis, By Company, Based on Revenue (2024)
Figure 22 India UPS Market, By UPS Type, CAGR (%), 2025-2033
Figure 23 India UPS Market Share (%), By UPS Type, 2024
Figure 24 India UPS Market Share (%), By UPS Type, 2033
Figure 25 India UPS Market, By Power Capacity, CAGR (%), 2025-2033
Figure 26 India UPS Market Share (%), By Power Capacity, 2024
Figure 27 India UPS Market Share (%), By Power Capacity, 2033
Figure 28 India UPS Market, By Phase Type, CAGR (%), 2025-2033
Figure 29 India UPS Market Share (%), By Phase Type, 2024
Figure 30 India UPS Market Share (%), By Phase Type, 2033
Figure 31 India UPS Market, By Battery Type, CAGR (%), 2025-2033
Figure 32 India UPS Market Share (%), By Battery Type, 2024
Figure 33 India UPS Market Share (%), By Battery Type, 2033
Figure 34 India UPS Market, By Location, CAGR (%), 2025-2033
Figure 35 India UPS Market Share (%), By Location, 2024
Figure 36 India UPS Market Share (%), By Location, 2033
Figure 37 India UPS Market, By End User, CAGR (%), 2025-2033
Figure 38 India UPS Market Share (%), By End User, 2024
Figure 39 India UPS Market Share (%), By End User, 2033
Figure 40 India UPS Market, By Distribution Channel, CAGR (%), 2025-2033
Figure 41 India UPS Market Share (%), By Distribution Channel, 2024
Figure 42 India UPS Market Share (%), By Distribution Channel, 2033
Figure 43 ABB Ltd.: Business Area Segmentation, 2024
Figure 44 ABB Ltd.: Geographical Revenue Segmentation, 2024
Figure 45 Cyber Power Systems, Inc.: Business Area Segmentation, 2024
Figure 46 Cyber Power Systems, Inc.: Geographical Revenue Segmentation, 2024
Figure 47 Delta Electronics, Inc.: Business Area Segmentation, 2024
Figure 48 Delta Electronics, Inc.: Geographical Revenue Segmentation, 2024
Figure 49 Eaton Corporation Plc: Business Area Segmentation, 2024
Figure 50 Eaton Corporation Plc: Geographical Revenue Segmentation, 2024
Figure 51 Emerson Electric Co.: Business Area Segmentation, 2024
Figure 52 Emerson Electric Co.: Geographical Revenue Segmentation, 2024
Figure 53 EnerSys: Business Area Segmentation, 2024
Figure 54 Hitachi, Ltd.: Business Area Segmentation, 2024
Figure 55 Hitachi, Ltd.: Geographical Revenue Segmentation, 2024
Figure 56 Legrand Group: Geographical Revenue Segmentation, 2024
Figure 57 Luminous Power Technologies: Business Area Segmentation, 2024
Figure 58 Luminous Power Technologies: Geographical Revenue Segmentation, 2024
Figure 59 Mitsubishi Electric Corporation.: Business Area Segmentation, 2024
Figure 60 Mitsubishi Electric Corporation.: Geographical Revenue Segmentation, 2024
Figure 61 Numeric Power Systems: Geographical Revenue Segmentation, 2024
Figure 62 Schneider Electric SE.: Business Area Segmentation, 2024
Figure 63 Schneider Electric SE.: Geographical Revenue Segmentation, 2024
Figure 64 Toshiba Corporation: Business Area Segmentation, 2024
Figure 65 Toshiba Corporation: Geographical Revenue Segmentation, 2024
Figure 66 Annexure: India Macro Economic Outlook/ Indicators
Figure 67 Annexure: India Macro Economic Outlook/ Indicators


Choose License Type


Features | Type of License | ||||
Data Book | Single User |   Multi User | Corporate | ||
| e-Access | ✓ | ✓ | ✓ | ✓ | |
User Sharing | 1 User Only | 1 User Only | Up to 7 Users | Unlimited User Access | |
⨉ | ⨉ | ⨉ | ✓ | ||
Free Customization | No Free Customization | Up To 30 hrs work | Up To 60 hrs work | Up To 80 hrs work | |
Deliverable |
| ⨉ | ✓ | ✓ | ✓ |
| ✓ | ⨉ | ✓ | ✓ | |
| ⨉ | ⨉ | ⨉ | ✓ | |
Analyst Support | 2-Months Analyst Support | 4-Months Analyst Support | 7-Months Analyst Support | One Year Analyst Support | |
Free Report update in next update cycle | ⨉ | ⨉ | ⨉ | ✓ | |
Free Industry Update (Within 180 days) | ⨉ | ⨉ | ⨉ | ✓ | |
Benefit | Up to 10% off on Post Purchase | Up to 20% off on Post Purchase | Up to 30% off on Post Purchase | Up to 40% off on Post Purchase | |