High Bandwidth Memory Market: By Product (Central Processing Unit, Field-Programmable Gate Array, Graphics Processing Unit, Application-Specific Integrated Circuit and Others); Application (High-Performance Computing (HPC), Networking and Client Space, Data Centers and Others; and Region–Industry Dynamics, Market Size and Opportunity Forecast For 2025–2033
- Last Updated: Jan-2025 | Format:
![pdf]()
![powerpoint]()
![excel]() | Report ID: AA0322178 | Delivery: 2 to 4 Hours22
| Report ID: AA0322178 | Delivery: 2 to 4 Hours22


 | Report ID: AA0322178 | Delivery: 2 to 4 Hours22
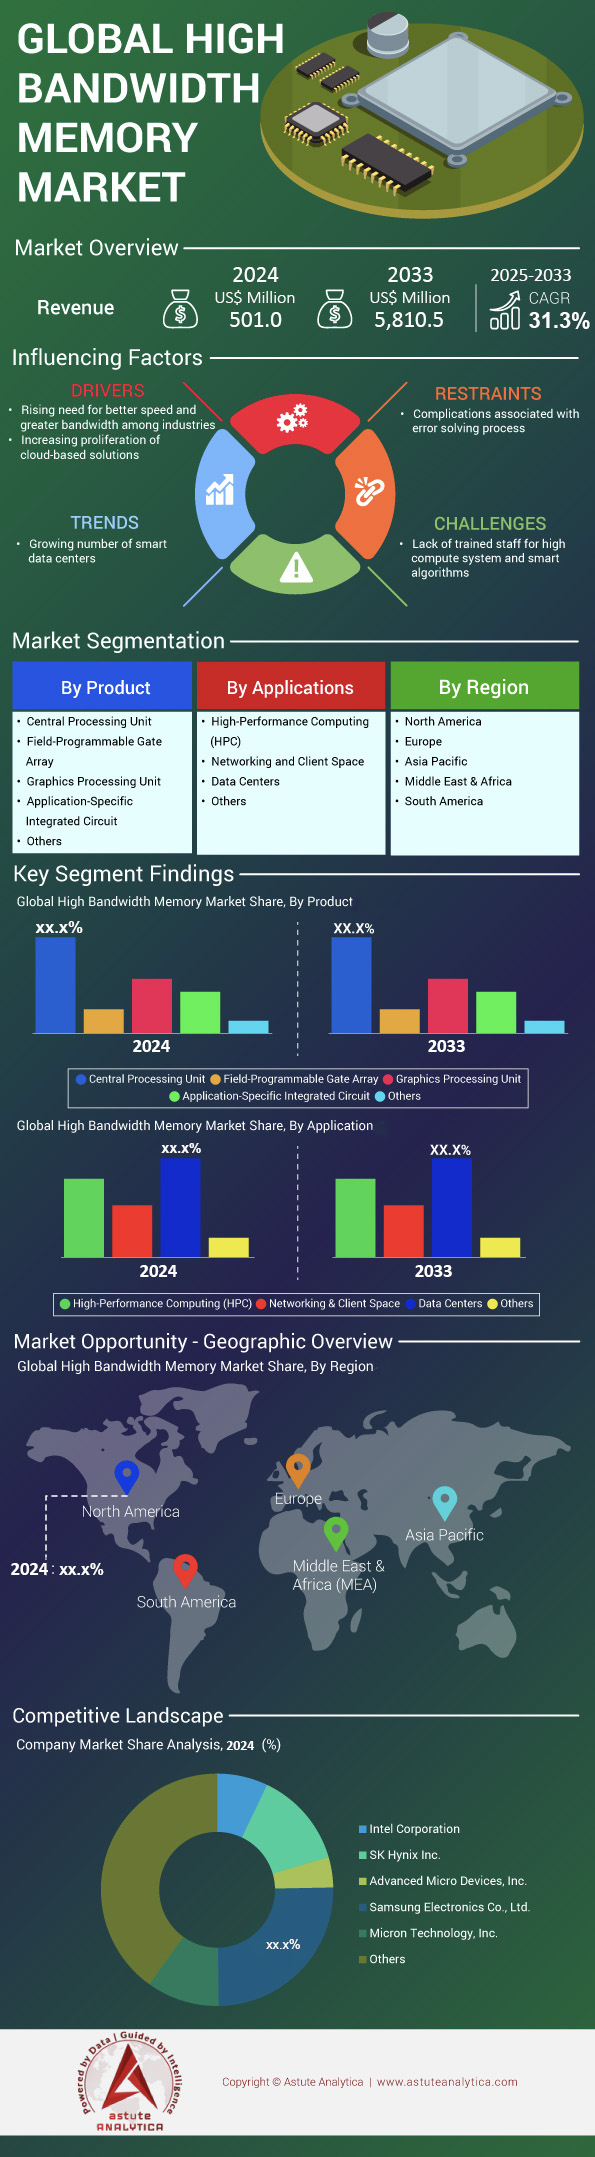
 Table 1:Global High Bandwidth Memory Market Size (US$ Mn), by Product, 2020-2033
Table 2:Global High Bandwidth Memory Market Size (US$ Mn), by Application, 2020-2033
Table 3:Global High Bandwidth Memory Market Size (US$ Mn), By Region, 2020-2033
Table 4:North America High Bandwidth Memory Market Size (US$ Mn), By Country, 2020-2033
Table 5:North America High Bandwidth Memory Market Size (US$ Mn), by Product, 2020-2033
Table 6:North America High Bandwidth Memory Market Size (US$ Mn), by Application, 2020-2033
Table 7:Europe High Bandwidth Memory Market Size (US$ Mn), By Country, 2020-2033
Table 8:Europe High Bandwidth Memory Market Size (US$ Mn), by Product, 2020-2033
Table 9:Europe High Bandwidth Memory Market Size (US$ Mn), by Application, 2020-2033
Table 10:Asia Pacific High Bandwidth Memory Market Size (US$ Mn), By Country, 2020-2033
Table 11:Asia Pacific High Bandwidth Memory Market Size (US$ Mn), by Product, 2020-2033
Table 12:Asia Pacific High Bandwidth Memory Market Size (US$ Mn), by Application, 2020-2033
Table 13:Middle East & Africa High Bandwidth Memory Market Size (US$ Mn), By Country, 2020-2033
Table 14:Middle East & Africa High Bandwidth Memory Market Size (US$ Mn), by Product, 2020-2033
Table 15:Middle East & Africa High Bandwidth Memory Market Size (US$ Mn), by Application, 2020-2033
Table 16:South America High Bandwidth Memory Market Size (US$ Mn), By Country, 2020-2033
Table 17:South America High Bandwidth Memory Market Size (US$ Mn), by Product, 2020-2033
Table 18:South America High Bandwidth Memory Market Size (US$ Mn), by Application, 2020-2033
Table 19:Advanced Micro Devices: Financial Analysis
Table 20:SK Hynix Inc.: Financial Analysis
Table 21:Micron Technology, Inc.: Financial Analysis
Table 22:Rambus Inc.: Financial Analysis
Table 23:Xilinx, Inc.: Financial Analysis
Table 24:NEC Corporation: Financial Analysis
Table 25:Cadence Design Systems, Inc.: Financial Analysis
Table 26:Intel Corporation: Financial Analysis
Table 27:Samsung Electronics: Financial Analysis
Figure1:Executive Summary: Global High Bandwidth Memory Market Size, By Value, 2024-2033 (US$ Million)
Figure2:Executive Summary: Global High Bandwidth Memory Market Size, By YoY Growth, 2024-2033 (%)
Figure3:COVID-19 Impact Assessment on Market Growth Trend: Analysis
Figure4:Global High Bandwidth Memory Market Share (%), by Geography, 2024
Figure5:Global GDDR DRAM Market Share (%), by Geography, 2024
Figure6:Competitive Dashboard: Market Share Analysis by Company, Based on Revenue (2024)
Figure7:Global High Bandwidth Memory Market, By Product, CAGR (%), 2024-2033
Figure8:Global High Bandwidth Memory Market Share (%), by Product, 2024
Figure9:Global High Bandwidth Memory Market Share (%), by Product, 2033
Figure10:Global High Bandwidth Memory Market, By Application, CAGR (%), 2024-2033
Figure11:Global High Bandwidth Memory Market Share (%), by Application, 2024
Figure12:Global High Bandwidth Memory Market Share (%), by Application, 2033
Figure13:Global High Bandwidth Memory Market, Top Segment CAGR (%), 2024-2033
Figure14:Global High Bandwidth Memory Market Share (%), by Geography, 2024
Figure15:Global High Bandwidth Memory Market Share (%), by Geography, 2033
Figure16:North America High Bandwidth Memory Market, Top Segment CAGR (%), 2024-2033
Figure17:North America High Bandwidth Memory Market Share (%), by Country, 2024
Figure18:North America High Bandwidth Memory Market Share (%), by Country, 2033
Figure19:North America High Bandwidth Memory Market Share (%), by Product, 2024
Figure20:North America High Bandwidth Memory Market Share (%), by Product, 2033
Figure21:North America High Bandwidth Memory Market Share (%), by Application, 2024
Figure22:North America High Bandwidth Memory Market Share (%), by Application, 2033
Figure23:Europe High Bandwidth Memory Market, Top Segment CAGR (%), 2024-2033
Figure24:Europe High Bandwidth Memory Market Share (%), by Country, 2024
Figure25:Europe High Bandwidth Memory Market Share (%), by Country, 2033
Figure26:Europe High Bandwidth Memory Market Share (%), by Product, 2024
Figure27:Europe High Bandwidth Memory Market Share (%), by Product, 2033
Figure28:Europe High Bandwidth Memory Market Share (%), by Application, 2024
Figure29:Europe High Bandwidth Memory Market Share (%), by Application, 2033
Figure30:Asia Pacific High Bandwidth Memory Market, Top Segment CAGR (%), 2024-2033
Figure31:Asia Pacific High Bandwidth Memory Market Share (%), by Country, 2024
Figure32:Asia Pacific High Bandwidth Memory Market Share (%), by Country, 2033
Figure33:Asia Pacific High Bandwidth Memory Market Share (%), by Product, 2024
Figure34:Asia Pacific High Bandwidth Memory Market Share (%), by Product, 2033
Figure35:Asia Pacific High Bandwidth Memory Market Share (%), by Application, 2024
Figure36:Asia Pacific High Bandwidth Memory Market Share (%), by Application, 2033
Figure37:Middle East & Africa High Bandwidth Memory Market, Top Segment CAGR (%), 2024-2033
Figure38:Middle East & Africa High Bandwidth Memory Market Share (%), by Country, 2024
Figure39:Middle East & Africa High Bandwidth Memory Market Share (%), by Country, 2033
Figure40:Middle East & Africa High Bandwidth Memory Market Share (%), by Product, 2024
Figure41:Middle East & Africa High Bandwidth Memory Market Share (%), by Product, 2033
Figure42:Middle East & Africa High Bandwidth Memory Market Share (%), by Application, 2024
Figure43:Middle East & Africa High Bandwidth Memory Market Share (%), by Application, 2033
Figure44:South America High Bandwidth Memory Market, Top Segment CAGR (%), 2024-2033
Figure45:South America High Bandwidth Memory Market Share (%), by Country, 2024
Figure46:South America High Bandwidth Memory Market Share (%), by Country, 2033
Figure47:South America High Bandwidth Memory Market Share (%), by Product, 2024
Figure48:South America High Bandwidth Memory Market Share (%), by Product, 2033
Figure49:South America High Bandwidth Memory Market Share (%), by Application, 2024
Figure50:South America High Bandwidth Memory Market Share (%), by Application, 2033
Figure51:Advanced Micro Devices: Business Revenue Segmentation, 2024
Figure52:Advanced Micro Devices: Geographical Revenue Segmentation, 2024
Figure53:SK Hynix Inc.: Geographical Revenue Segmentation, 2024
Figure54:Micron Technology, Inc.: Business Revenue Segmentation, 2024
Figure55:Micron Technology, Inc.: Geographical Revenue Segmentation, 2024
Figure56:Rambus Inc.: Business Revenue Segmentation, 2024
Figure57:Rambus Inc.: Geographical Revenue Segmentation, 2024
Figure58:Xilinx, Inc.: Geographical Revenue Segmentation, 2024
Figure59:NEC Corporation: Business Revenue Segmentation, 2024
Figure60:Cadence Design Systems, Inc.: Business Revenue Segmentation, 2024
Figure61:Cadence Design Systems, Inc.: Geographical Revenue Segmentation, 2024
Figure62:Intel Corporation: Business Revenue Segmentation, 2024
Figure63:Intel Corporation: Geographical Revenue Segmentation, 2024
Figure64:Samsung Electronics: Business Revenue Segmentation, 2024
Figure65:Samsung Electronics: Geographical Revenue Segmentation, 2024


Choose License Type


Features | Type of License | ||||
Data Book | Single User |   Multi User | Corporate | ||
| e-Access | ✓ | ✓ | ✓ | ✓ | |
User Sharing | 1 User Only | 1 User Only | Up to 7 Users | Unlimited User Access | |
⨉ | ⨉ | ⨉ | ✓ | ||
Free Customization | No Free Customization | Up To 30 hrs work | Up To 60 hrs work | Up To 80 hrs work | |
Deliverable |
| ⨉ | ✓ | ✓ | ✓ |
| ✓ | ⨉ | ✓ | ✓ | |
| ⨉ | ⨉ | ⨉ | ✓ | |
Analyst Support | 2-Months Analyst Support | 4-Months Analyst Support | 7-Months Analyst Support | One Year Analyst Support | |
Free Report update in next update cycle | ⨉ | ⨉ | ⨉ | ✓ | |
Free Industry Update (Within 180 days) | ⨉ | ⨉ | ⨉ | ✓ | |
Benefit | Up to 10% off on Post Purchase | Up to 20% off on Post Purchase | Up to 30% off on Post Purchase | Up to 40% off on Post Purchase | |