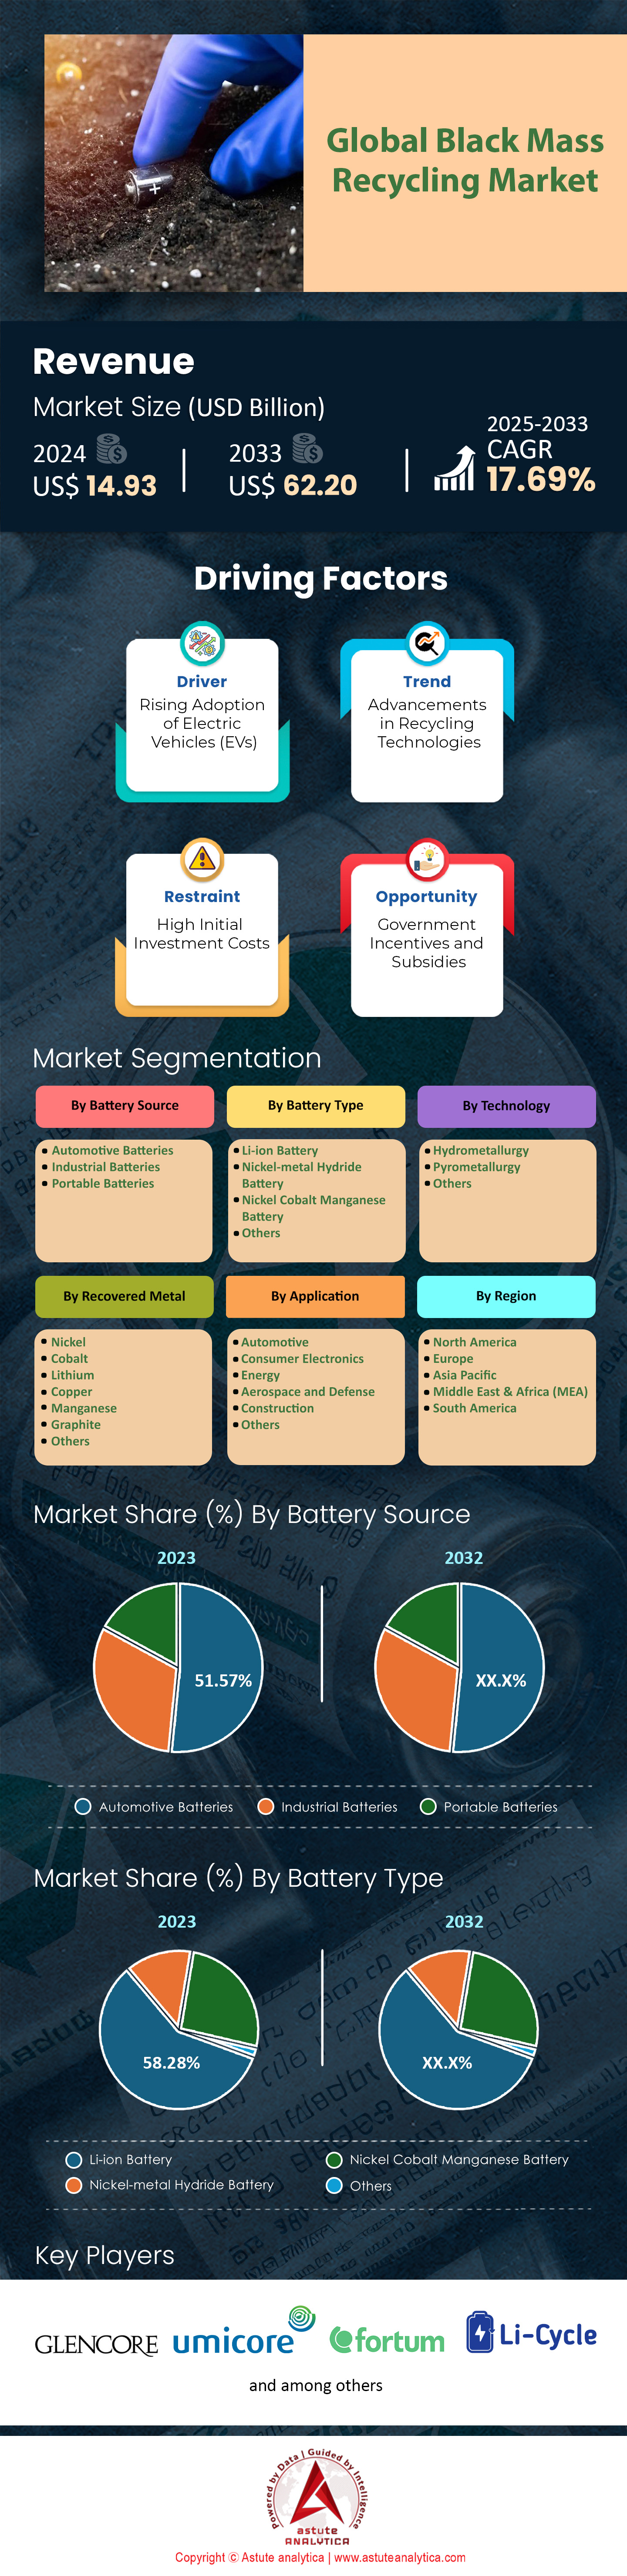
Black Mass Recycling Market: By Battery Source (Automotive Batteries, Industrial Batteries, Portable Batteries); Battery Type (Li-ion Battery, Nickel-metal Hydride Battery, Nickel Cobalt Manganese Battery, Others); Technology (Hydrometallurgy, Pyrometallurgy, Others); Recovered Metal (Nickel, Cobalt, Lithium, Copper, Manganese, Graphite, Others); Applications (Automotive, Consumer Electronics, Energy, Aerospace and Defense, Construction, Others); Region—Market Size, Industry Dynamics, Opportunity Analysis and Forecast for 2025–2033
- Last Updated: Dec-2024 | Format:
![pdf]()
![powerpoint]()
![excel]() | Report ID: AA12241013 | Delivery: Immediate Access
| Report ID: AA12241013 | Delivery: Immediate Access


 | Report ID: AA12241013 | Delivery: Immediate Access
 Table:1 Industry Outlook: Component
Table:2 PESTLE Impact Analysis: Political Factors
Table:3 PESTLE Impact Analysis: Economic Factors
Table:4 PESTLE Impact Analysis: Social Factors
Table:5 PESTLE Impact Analysis: Technological Factors
Table:6 PESTLE Impact Analysis: Legal Factors
Table:7 PESTLE Impact Analysis: Environmental Factors
Table:8 Driver: Launch Date
Table:9 Market Dynamics And Trends: Impact Analysis of Market Dynamics
Table:10 Product Price Analysis: Battery Source-based Price Analysis
Table:11 Competitive Dashboard: Global Black Mass Recycling Market Competitors Mapping & Benchmarking
Table:12 Global Black Mass Recycling Market Size (US$ Bn), By Battery Source, 2020-2033
Table:13 Global Black Mass Recycling Market Size (US$ Bn), By Battery Type, 2020-2033
Table:14 Global Black Mass Recycling Market Size (US$ Bn), By Technology, 2020-2033
Table:15 Global Black Mass Recycling Market Size (US$ Bn), By Recovered Metal, 2020-2033
Table:16 Global Black Mass Recycling Market Size (US$ Bn), By Application, 2020-2033
Table:17 Global Black Mass Recycling Market Size (US$ Bn), By Region, 2020-2033
Table:18 North America Black Mass Recycling Market Size (US$ Bn), By Country, 2020-2033
Table:19 North America Black Mass Recycling Market Size (US$ Bn), By Battery Source, 2020-2033
Table:20 North America Black Mass Recycling Market Size (US$ Bn), By Battery Type, 2020-2033
Table:21 North America Black Mass Recycling Market Size (US$ Bn), By Technology, 2020-2033
Table:22 North America Black Mass Recycling Market Size (US$ Bn), By Recovered Metal, 2020-2033
Table:23 North America Black Mass Recycling Market Size (US$ Bn), By Application, 2020-2033
Table:24 Europe Black Mass Recycling Market Size (US$ Bn), By Country, 2020-2033
Table:25 Europe Black Mass Recycling Market Size (US$ Bn), By Battery Source, 2020-2033
Table:26 Europe Black Mass Recycling Market Size (US$ Bn), By Battery Type, 2020-2033
Table:27 Europe Black Mass Recycling Market Size (US$ Bn), By Technology, 2020-2033
Table:28 Europe Black Mass Recycling Market Size (US$ Bn), By Recovered Metal, 2020-2033
Table:29 Europe Black Mass Recycling Market Size (US$ Bn), By Application, 2020-2033
Table:30 Asia Pacific Black Mass Recycling Market Size (US$ Bn), By Country, 2020-2033
Table:31 Asia Pacific Black Mass Recycling Market Size (US$ Bn), By Battery Source, 2020-2033
Table:32 Asia Pacific Black Mass Recycling Market Size (US$ Bn), By Battery Type, 2020-2033
Table:33 Asia Pacific Black Mass Recycling Market Size (US$ Bn), By Technology, 2020-2033
Table:34 Asia Pacific Black Mass Recycling Market Size (US$ Bn), By Recovered Metal, 2020-2033
Table:35 Asia Pacific Black Mass Recycling Market Size (US$ Bn), By Application, 2020-2033
Table:36 Middle East & Africa Black Mass Recycling Market Size (US$ Bn), By Country, 2020-2033
Table:37 Middle East & Africa Black Mass Recycling Market Size (US$ Bn), By Battery Source, 2020-2033
Table:38 Middle East & Africa Black Mass Recycling Market Size (US$ Bn), By Battery Type, 2020-2033
Table:39 Middle East & Africa Black Mass Recycling Market Size (US$ Bn), By Technology, 2020-2033
Table:40 Middle East & Africa Black Mass Recycling Market Size (US$ Bn), By Recovered Metal, 2020-2033
Table:41 Middle East & Africa Black Mass Recycling Market Size (US$ Bn), By Application, 2020-2033
Table:42 South America Black Mass Recycling Market Size (US$ Bn), By Country, 2020-2033
Table:43 South America Black Mass Recycling Market Size (US$ Bn), By Battery Source, 2020-2033
Table:44 South America Black Mass Recycling Market Size (US$ Bn), By Battery Type, 2020-2033
Table:45 South America Black Mass Recycling Market Size (US$ Bn), By Technology, 2020-2033
Table:46 South America Black Mass Recycling Market Size (US$ Bn), By Recovered Metal, 2020-2033
Table:47 South America Black Mass Recycling Market Size (US$ Bn), By Application, 2020-2033
Table:48 Contemporary Amperex Technology Co., Limited: Recent Developments
Table:49 Contemporary Amperex Technology Co., Limited: Offering
Table:50 Cirba Solutions: Recent Developments
Table:51 Cirba Solutions: Offering
Table:52 Glencore: Recent Developments
Table:53 Glencore: Offering
Table:54 Glencore : Financial Analysis
Table:55 RecycLiCo Battery Materials: Recent Developments
Table:56 RecycLiCo Battery Materials: Offering
Table:57 Umicore: Recent Developments
Table:58 Umicore: Offering
Table:59 Umicore.: Financial Analysis
Table:60 Redwood Materials Inc.: Recent Developments
Table:61 Redwood Materials Inc.: Offering
Table:62 Tenova S.p.A.: Products
Table:63 Li-Cycle Corp.: Recent Developments
Table:64 Li-Cycle Corp.: Products
Table:65 Li-Cycle Corp. : Financial Analysis
Table:66 Metso: Recent Developments
Table:67 Metso: Products
Table:68 Metso : Financial Analysis
Table:69 Lithion Technologies: Recent Developments
Table:70 Lithion Technologies: Products
Table:71 BASF SE: Products
Table:72 BASF SE : Financial Analysis
Table:73 Akkuser Oy: Products
Table:74 Duesenfeld GmbH: Products
Table:75 Aqua Metals, Inc.: Recent Developments
Table:76 Aqua Metals, Inc.: Products
Table:77 Fortum: Recent Developments
Table:78 Fortum: Products
Table:79 Fortum : Financial Analysis
Table:80 Other Prominent Players
Table:81 Annexure: Secondary Sources
Figure: 1 Executive Summary: Global Black Mass Recycling Market Size and Forecast, 2020-2033 (US$ Bn)
Figure: 2 Executive Summary: Top Segments, CAGR % (2024-2033)
Figure: 3 Industry Outlook: Number of New EV Cars Sold Globally
Figure: 4 Industry Outlook: EV Car Sales, 2020 (In Million)
Figure: 5 Industry Outlook: Lithium-ion battery manufacturing capacity, 2022-2030 (TWh)
Figure: 6 Adoption Analysis: Adoption Rate (%), By Battery Source
Figure: 7 Adoption Analysis: Global Black Mass Recycling Market, By Y-o-Y (%), 2021-2033
Figure: 8 Adoption Analysis: Revenue Comparison (US$ Bn), By Battery Type
Figure: 9 Driver: CO2 Emission from Transport, By Sector 2021 (%)
Figure: 10 Driver: Share Of Global Market With Policy Coverage for EV, 2022
Figure: 11 Competitive Dashboard: Market Share Analysis by Company, Based on Revenue (2020)
Figure: 12 Global Black Mass Recycling Market, By Battery Source, CAGR (%), 2024-2033
Figure: 13 Global Black Mass Recycling Market Share (%), By Battery Source, 2020
Figure: 14 Global Black Mass Recycling Market Share (%), By Battery Source, 2033
Figure: 15 Global Black Mass Recycling Market, By Battery Type, CAGR (%), 2024-2033
Figure: 16 Global Black Mass Recycling Market Share (%), By Battery Type, 2020
Figure: 17 Global Black Mass Recycling Market Share (%), By Battery Type, 2033
Figure: 18 Global Black Mass Recycling Market, By Technology, CAGR (%), 2024-2033
Figure: 19 Global Black Mass Recycling Market Share (%), By Technology, 2020
Figure: 20 Global Black Mass Recycling Market Share (%), By Technology, 2033
Figure: 21 Global Black Mass Recycling Market, By Recovered Metal, CAGR (%), 2024-2033
Figure: 22 Global Black Mass Recycling Market Share (%), By Recovered Metal, 2020
Figure: 23 Global Black Mass Recycling Market Share (%), By Recovered Metal, 2033
Figure: 24 Global Black Mass Recycling Market, By Application, CAGR (%), 2024-2033
Figure: 25 Global Black Mass Recycling Market Share (%), By Application, 2020
Figure: 26 Global Black Mass Recycling Market Share (%), By Application, 2033
Figure: 27 Global Black Mass Recycling Market, By Region, CAGR (%), 2024-2033
Figure: 28 Global Black Mass Recycling Market Share (%), By Region, 2020
Figure: 29 Global Black Mass Recycling Market Share (%), By Region, 2033
Figure: 30 North America: Highest Share (%) Segment
Figure: 31 North America :Net Opportunity Addition, in US$ Bn
Figure: 32 North America: Text Analysis
Figure: 33 North America: Opportunity Assessment, By Battery Source
Figure: 34 North America: Opportunity Assessment, By Battery Type
Figure: 35 North America: Opportunity Assessment, By Technology
Figure: 36 North America: Opportunity Assessment, By Recovered Metal
Figure: 37 North America: Opportunity Assessment, By Application
Figure: 38 North America Black Mass Recycling Market Share (%), By Country, 2020
Figure: 39 North America Black Mass Recycling Market Share (%), By Country, 2033
Figure: 40 North America Black Mass Recycling Market Share (%), By Battery Source, 2020
Figure: 41 North America Black Mass Recycling Market Share (%), By Battery Source, 2033
Figure: 42 North America Black Mass Recycling Market Share (%), By Battery Type, 2020
Figure: 43 North America Black Mass Recycling Market Share (%), By Battery Type, 2033
Figure: 44 North America Black Mass Recycling Market Share (%), By Technology, 2020
Figure: 45 North America Black Mass Recycling Market Share (%), By Technology, 2033
Figure: 46 North America Black Mass Recycling Market Share (%), By Recovered Metal, 2020
Figure: 47 North America Black Mass Recycling Market Share (%), By Recovered Metal, 2033
Figure: 48 North America Black Mass Recycling Market Share (%), By Application, 2020
Figure: 49 North America Black Mass Recycling Market Share (%), By Application, 2033
Figure: 50 Europe: Highest Share (%) Segment
Figure: 51 Europe :Net Opportunity Addition, in US$ Bn
Figure: 52 Europe: Text Analysis
Figure: 53 Europe: Opportunity Assessment, By Battery Source
Figure: 54 Europe: Opportunity Assessment, By Battery Type
Figure: 55 Europe: Opportunity Assessment, By Technology
Figure: 56 Europe: Opportunity Assessment, By Recovered Metal
Figure: 57 Europe: Opportunity Assessment, By Application
Figure: 58 Europe Black Mass Recycling Market Share (%), By Country, 2020
Figure: 59 Europe Black Mass Recycling Market Share (%), By Country, 2033
Figure: 60 Europe Black Mass Recycling Market Share (%), By Battery Source, 2020
Figure: 61 Europe Black Mass Recycling Market Share (%), By Battery Source, 2033
Figure: 62 Europe Black Mass Recycling Market Share (%), By Battery Type, 2020
Figure: 63 Europe Black Mass Recycling Market Share (%), By Battery Type, 2033
Figure: 64 Europe Black Mass Recycling Market Share (%), By Technology, 2020
Figure: 65 Europe Black Mass Recycling Market Share (%), By Technology, 2033
Figure: 66 Europe Black Mass Recycling Market Share (%), By Recovered Metal, 2020
Figure: 67 Europe Black Mass Recycling Market Share (%), By Recovered Metal, 2033
Figure: 68 Europe Black Mass Recycling Market Share (%), By Application, 2020
Figure: 69 Europe Black Mass Recycling Market Share (%), By Application, 2033
Figure: 70 Asia Pacific : Highest Share (%) Segment
Figure: 71 Asia Pacific :Net Opportunity Addition, in US$ Bn
Figure: 72 Asia Pacific : Text Analysis
Figure: 73 Asia Pacific : Opportunity Assessment, By Battery Source
Figure: 74 Asia Pacific : Opportunity Assessment, By Battery Type
Figure: 75 Asia Pacific : Opportunity Assessment, By Technology
Figure: 76 Asia Pacific : Opportunity Assessment, By Recovered Metal
Figure: 77 Asia Pacific : Opportunity Assessment, By Application
Figure: 78 Asia Pacific Black Mass Recycling Market Share (%), By Country, 2020
Figure: 79 Asia Pacific Black Mass Recycling Market Share (%), By Country, 2033
Figure: 80 Asia Pacific Black Mass Recycling Market Share (%), By Battery Source, 2020
Figure: 81 Asia Pacific Black Mass Recycling Market Share (%), By Battery Source, 2033
Figure: 82 Asia Pacific Black Mass Recycling Market Share (%), By Battery Type, 2020
Figure: 83 Asia Pacific Black Mass Recycling Market Share (%), By Battery Type, 2033
Figure: 84 Asia Pacific Black Mass Recycling Market Share (%), By Technology, 2020
Figure: 85 Asia Pacific Black Mass Recycling Market Share (%), By Technology, 2033
Figure: 86 Asia Pacific Black Mass Recycling Market Share (%), By Recovered Metal, 2020
Figure: 87 Asia Pacific Black Mass Recycling Market Share (%), By Recovered Metal, 2033
Figure: 88 Asia Pacific Black Mass Recycling Market Share (%), By Application, 2020
Figure: 89 Asia Pacific Black Mass Recycling Market Share (%), By Application, 2033
Figure: 90 Middle East & Africa : Highest Share (%) Segment
Figure: 91 Middle East & Africa :Net Opportunity Addition, in US$ Bn
Figure: 92 Middle East & Africa : Text Analysis
Figure: 93 Middle East & Africa : Opportunity Assessment, By Battery Source
Figure: 94 Middle East & Africa : Opportunity Assessment, By Battery Type
Figure: 95 Middle East & Africa : Opportunity Assessment, By Technology
Figure: 96 Middle East & Africa : Opportunity Assessment, By Recovered Metal
Figure: 97 Middle East & Africa : Opportunity Assessment, By Application
Figure: 98 Middle East & Africa Black Mass Recycling Market Share (%), By Country, 2020
Figure: 99 Middle East & Africa Black Mass Recycling Market Share (%), By Country, 2033
Figure: 100 Middle East & Africa Black Mass Recycling Market Share (%), By Battery Source, 2020
Figure: 101 Middle East & Africa Black Mass Recycling Market Share (%), By Battery Source, 2033
Figure: 102 Middle East & Africa Black Mass Recycling Market Share (%), By Battery Type, 2020
Figure: 103 Middle East & Africa Black Mass Recycling Market Share (%), By Battery Type, 2033
Figure: 104 Middle East & Africa Black Mass Recycling Market Share (%), By Technology, 2020
Figure: 105 Middle East & Africa Black Mass Recycling Market Share (%), By Technology, 2033
Figure: 106 Middle East & Africa Black Mass Recycling Market Share (%), By Recovered Metal, 2020
Figure: 107 Middle East & Africa Black Mass Recycling Market Share (%), By Recovered Metal, 2033
Figure: 108 Middle East & Africa Black Mass Recycling Market Share (%), By Application, 2020
Figure: 109 Middle East & Africa Black Mass Recycling Market Share (%), By Application, 2033
Figure: 110 South America : Highest Share (%) Segment
Figure: 111 South America :Net Opportunity Addition, in US$ Bn
Figure: 112 South America : Text Analysis
Figure: 113 South America : Opportunity Assessment, By Battery Source
Figure: 114 South America : Opportunity Assessment, By Battery Type
Figure: 115 South America : Opportunity Assessment, By Technology
Figure: 116 South America : Opportunity Assessment, By Recovered Metal
Figure: 117 South America : Opportunity Assessment, By Application
Figure: 118 South America Black Mass Recycling Market Share (%), By Country, 2020
Figure: 119 South America Black Mass Recycling Market Share (%), By Country, 2033
Figure: 120 South America Black Mass Recycling Market Share (%), By Battery Source, 2020
Figure: 121 South America Black Mass Recycling Market Share (%), By Battery Source, 2033
Figure: 122 South America Black Mass Recycling Market Share (%), By Battery Type, 2020
Figure: 123 South America Black Mass Recycling Market Share (%), By Battery Type, 2033
Figure: 124 South America Black Mass Recycling Market Share (%), By Technology, 2020
Figure: 125 South America Black Mass Recycling Market Share (%), By Technology, 2033
Figure: 126 South America Black Mass Recycling Market Share (%), By Recovered Metal, 2020
Figure: 127 South America Black Mass Recycling Market Share (%), By Recovered Metal, 2033
Figure: 128 South America Black Mass Recycling Market Share (%), By Application, 2020
Figure: 129 South America Black Mass Recycling Market Share (%), By Application, 2033
Figure: 130 Glencore: Business Revenue Segmentation 2020
Figure: 131 Glencore: Geographical Revenue Segmentation, 2020
Figure: 132 Umicore: Business Revenue Segmentation, 2020
Figure: 133 Umicore: Geographical Revenue Segmentation, 2020
Figure: 134 Li-Cycle Corp.: Business Revenue Segmentation, 2020
Figure: 135 Li-Cycle Corp.: Geographical Revenue Segmentation, 2020
Figure: 136 Metso: Business Revenue Segmentation, 2020
Figure: 137 Metso: Geographical Revenue Segmentation, 2020
Figure: 138 BASF SE: Business Revenue Segmentation, 2020
Figure: 139 BASF SE: Geographical Revenue Segmentation, 2020
Figure: 140 Fortum: Business Revenue Segmentation, 2020
Figure: 141 Fortum: Geographical Revenue Segmentation, 2020
Figure: 142 Annexure: GDP, Current Prices (Billions of U.S. dollars)
Figure: 143 Annexure: GDP Per Capita, Current Prices (U.S. Dollars Per Capita)
Figure: 144 Annexure: Industry (including construction), value added (% of GDP)
Figure: 145 Annexure: Registrations Or Sales Of New Vehicles - All Types


Choose License Type


Features | Type of License | ||||
Data Book | Single User |   Multi User | Corporate | ||
| e-Access | ✓ | ✓ | ✓ | ✓ | |
User Sharing | 1 User Only | 1 User Only | Up to 7 Users | Unlimited User Access | |
⨉ | ⨉ | ⨉ | ✓ | ||
Free Customization | No Free Customization | Up To 30 hrs work | Up To 60 hrs work | Up To 80 hrs work | |
Deliverable |
| ⨉ | ✓ | ✓ | ✓ |
| ✓ | ⨉ | ✓ | ✓ | |
| ⨉ | ⨉ | ⨉ | ✓ | |
Analyst Support | 2-Months Analyst Support | 4-Months Analyst Support | 7-Months Analyst Support | One Year Analyst Support | |
Free Report update in next update cycle | ⨉ | ⨉ | ⨉ | ✓ | |
Free Industry Update (Within 180 days) | ⨉ | ⨉ | ⨉ | ✓ | |
Benefit | Up to 10% off on Post Purchase | Up to 20% off on Post Purchase | Up to 30% off on Post Purchase | Up to 40% off on Post Purchase | |