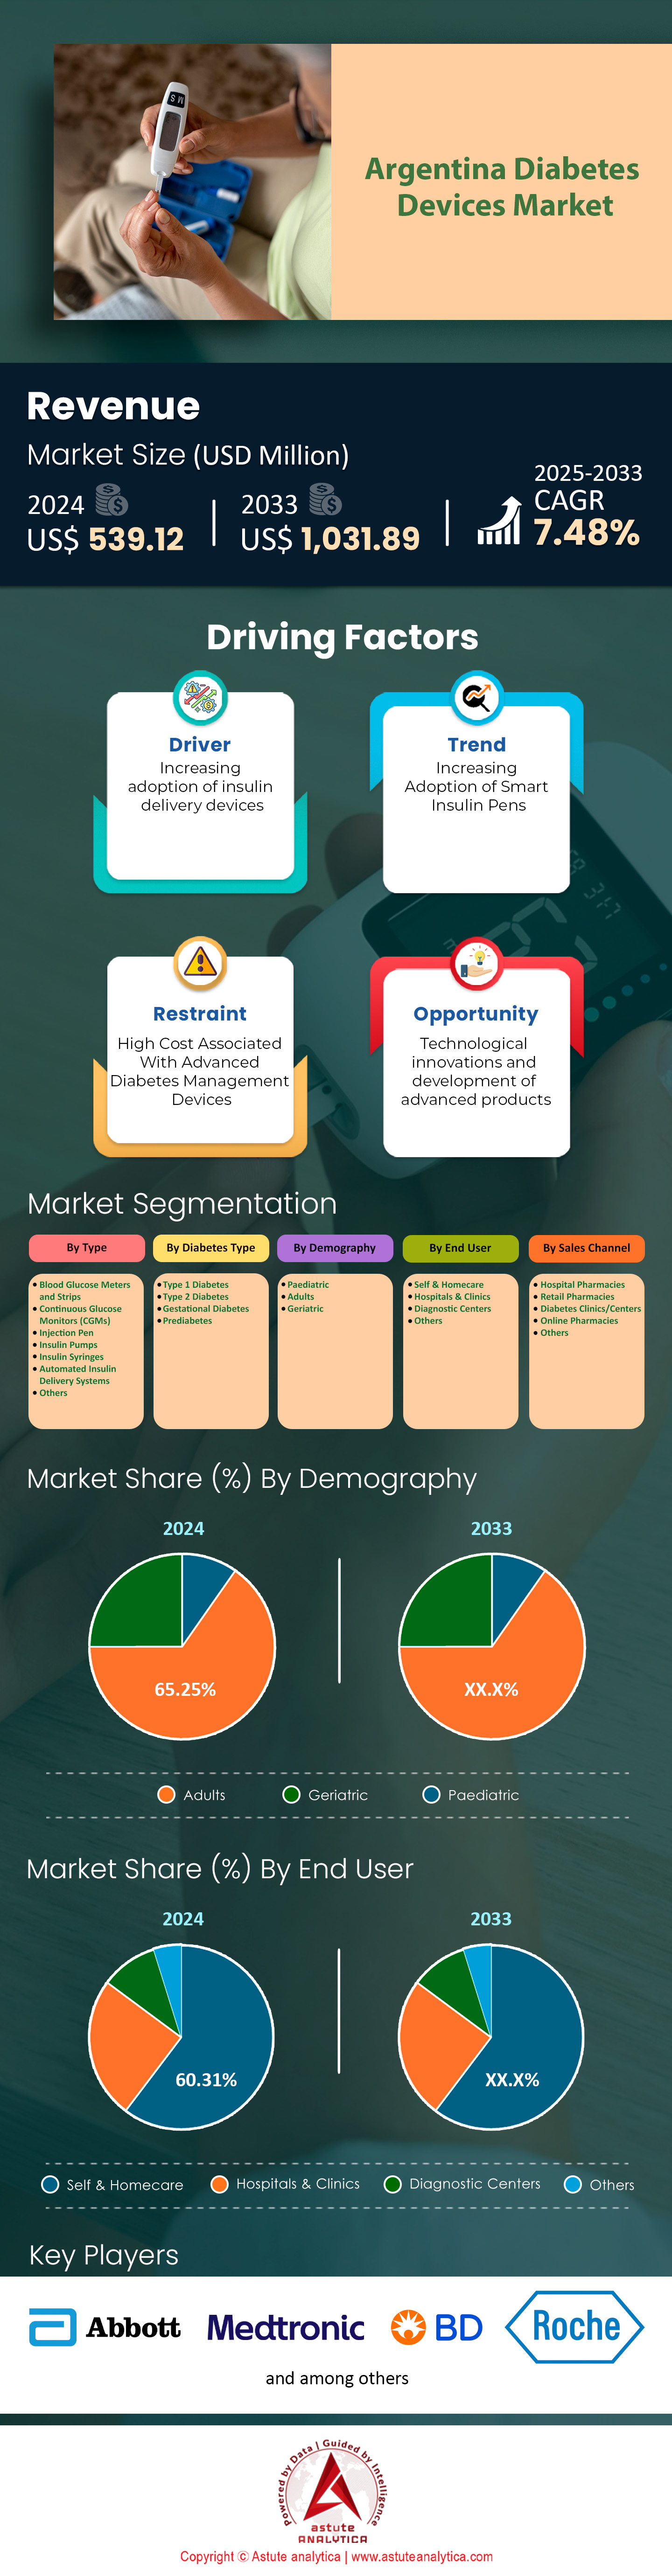
Argentina Diabetes Devices Market: By Type (Blood Glucose Meters and Strips, Continuous Glucose Monitors (CGMs), Injection Pen, Insulin Pumps, Insulin Syringes, Automated Insulin Delivery Systems, Others); Diabetes Type (Type 1 Diabetes, Type 2 Diabetes, Gestational Diabetes, Prediabetes); Demographics (Paediatric, Adults, Geriatric); End Users (Self & Homecare, Hospitals & Clinics, Diagnostic Centers, Others); Sales Channel (Hospital Pharmacies, Retail Pharmacies, Diabetes, Clinics/Centers, Online Pharmacies, Others)–Market Size, Industry Dynamics, Opportunity Analysis and Forecast for 2025–2033
- Last Updated: Dec-2024 | Format:
![pdf]()
![powerpoint]()
![excel]() | Report ID: AA12241039 | Delivery: Immediate Access
| Report ID: AA12241039 | Delivery: Immediate Access


 | Report ID: AA12241039 | Delivery: Immediate Access
 Table 1 Argentina Diabetes Devices Market: Overview: Types of digital health apps used for managing diabetes
Table 2 Industry Outlook: Analysis on Diabetes Stats & Facts Across Argentina
Table 3 Industry Outlook: Diabetes estimates (20-79 y)
Table 4 Industry Outlook: Impaired glucose tolerance (IGT) estimates (20-79 y)
Table 5 Industry Outlook: Impaired fasting glucose (IFG) estimates (20-79 y)
Table 6 Industry Outlook: Mortality attributable to diabetes (20-79 y)
Table 7 Industry Outlook: Diabetes-related health expenditure
Table 8 Industry Outlook: Demographics
Table 9 Market Dynamics & Trends – Driver: National Response to Diabetes: Policies, guidelines and monitoring
Table 10 Argentina Diabetes Devices Market Size (US$ Mn), By Type, 2020-2033
Table 11 Argentina Diabetes Devices Market Size And Forecast, By Type Argentina Diabetes Devices Market Size (US$ Mn), By Diabetes Type, 2020-2033
Table 12 Argentina Diabetes Devices Market Size (US$ Mn), By Demography, 2020-2033
Table 13 Argentina Diabetes Devices Market Size (US$ Mn), By End User, 2020-2033
Table 14 Argentina Diabetes Devices Market Size (US$ Mn), By Sales Channel, 2020-2033
Table 15 Abbott Laboratories: Recent Developments
Table 16 Abbott Laboratories: Products
Table 17 Abbott Laboratories: Financial Analysis
Table 18 Ascensia Diabetes Care HoldingsL: Recent Developments
Table 19 Ascensia Diabetes Care Holdings: Products
Table 20 PHC Holdings Corporation: Financial Analysis
Table 21 B. Braun: Products
Table 22 B Braun.: Financial Analysis
Table 23 Embecta : Financial Analysis
Table 24 Becton, Dickinson and Company: Recent Developments
Table 25 Becton, Dickinson and Company: Products
Table 26 Dickinson and Company: Financial Analysis
Table 27 Convatec Group plc: Recent Developments
Table 28 Convatec Group plc: Solution
Table 29 Convatec Group plc: Financial Analysis
Table 30 Dexcom Inc.: Recent Developments
Table 31 Dexcom Inc.: Products
Table 32 Dexcom Inc.: Financial Analysis
Table 33 F. Hoffmann-La Roche AG: Recent Developments
Table 34 F. Hoffmann-La Roche AG: Solution
Table 35 F. Hoffmann-La Roche AG: Financial Analysis
Table 36 Medtronic plc: Recent Developments
Table 37 Medtronic plc: Solution
Table 38 Medtronic plc: Financial Analysis
Table 39 Novo Nordisk A/S.: Recent Developments
Table 40 Novo Nordisk A/S.: Products
Table 41 Novo Nordisk A/S.: Financial Analysis
Table 42 Stevanato Group.: Recent Developments
Table 43 Stevanato Group.: Products
Table 44 Stevanato Group.: Financial Analysis
Table 45 Terumo Corporation: Recent Developments
Table 46 Terumo Corporation: Products
Table 47 Terumo Corporation: Financial Analysis
Table 48 LifeScan IP Holdings, LLC.: Recent Developments
Table 49 LifeScan IP Holdings, LLC.: Products
Table 50 ViCentra BV: Recent Developments
Table 51 ViCentra BV: Products
Table 52 Other Prominent Players
Figure 1 Argentina Diabetes Devices Market Size and Forecast, 2020-2033 (US$ Mn)
Figure 2 Argentina Diabetes Devices Market Share (%), By Type
Figure 3 Argentina Diabetes Devices Market Share (%), By Diabetes Type
Figure 4 Argentina Diabetes Devices Market Share (%), By Demography
Figure 5 Argentina Diabetes Devices Market Share (%), By End User
Figure 6 Argentina Diabetes Devices Market Share (%), By Sales Channel
Figure 7 Argentina Diabetes Devices Market: Overview
Figure 8 Market Dynamics & Trends – Driver: Number of adults with diabetes (20 - 79 years)
Figure 9 Covid-19 Impact Assessment on Market Growth Trend: Argentina Diabetes Device Market, Covid-19 Impact & Recovery, 2019-2033 Y-o-Y(%)
Figure 10 Argentina Diabetes Devices Market: Competitor Analysis: Market Concentration Rate (2024)
Figure 11 Argentina Diabetes Devices Market: Competitor Analysis: Market Share Analysis by Company, Based on Revenue (2024)
Figure 12 Argentina Diabetes Devices Market, By Type, CAGR (%), 2024-2033
Figure 13 Argentina Diabetes Devices Market Share (%), By Type, 2024
Figure 14 Argentina Diabetes Devices Market Share (%), By Type, 2033
Figure 15 Argentina Diabetes Devices Market, By Diabetes Type, CAGR (%), 2024-2033
Figure 16 Argentina Diabetes Devices Market Share (%), By Diabetes Type, 2024
Figure 17 Argentina Diabetes Devices Market Share (%), By Diabetes Type, 2033
Figure 18 Argentina Diabetes Devices Market, By Demography, CAGR (%), 2024-2033
Figure 19 Argentina Diabetes Devices Market Share (%), By Demography, 2024
Figure 20 Argentina Diabetes Devices Market Share (%), By Demography, 2033
Figure 21 Argentina Diabetes Devices Market, By End User, CAGR (%), 2024-2033
Figure 22 Argentina Diabetes Devices Market Share (%), By End User, 2024
Figure 23 Argentina Diabetes Devices Market Share (%), By End User, 2033
Figure 24 Argentina Diabetes Devices Market, By Sales Channel, CAGR (%), 2024-2033
Figure 25 Argentina Diabetes Devices Market Share (%), By Sales Channel, 2024
Figure 26 Argentina Diabetes Devices Market Share (%), By Sales Channel, 2033
Figure 27 Abbott Laboratories: Business Revenue Segmentation, 2024
Figure 28 Abbott Laboratories: Geographical Revenue Segmentation, 2024
Figure 29 Ascensia Diabetes Care Holdings: Business Revenue Segmentation, 2024
Figure 30 Ascensia Diabetes Care Holdings: Business Revenue Segmentation, 2024
Figure 31 B. Braun: Business Revenue Segmentation, 2024
Figure 32 B. Braun: Geographical Revenue Segmentation, 2024
Figure 33 Becton, Dickinson and Company (Embecta): Embecta Geographical Revenue Segmentation, 2024
Figure 34 Becton, Dickinson and Company: Business Revenue Segmentation, 2024
Figure 35 Becton, Dickinson and Company: Geographical Revenue Segmentation, 2024
Figure 36 Convatec Group plc: Business Revenue Segmentation, 2024
Figure 37 Convatec Group plc: Geographical Revenue Segmentation, 2024
Figure 38 Dexcom Inc.: Geographical Revenue Segmentation, 2024
Figure 39 F. Hoffmann-La Roche AG: Business Revenue Segmentation, 2024
Figure 40 F. Hoffmann-La Roche AG: Geographical Revenue Segmentation, 2024
Figure 41 Medtronic plc: Business Revenue Segmentation, 2024
Figure 42 Medtronic plc: Geographical Revenue Segmentation, 2024
Figure 43 Novo Nordisk A/S.: Business Revenue Segmentation, 2024
Figure 44 Novo Nordisk A/S.: Geographical Revenue Segmentation, 2024
Figure 45 Stevanato Group.: Business Revenue Segmentation, 2024
Figure 46 Stevanato Group.: Geographical Revenue Segmentation, 2024
Figure 47 Terumo Corporation: Business Revenue Segmentation, 2024
Figure 48 Terumo Corporation: Geographical Revenue Segmentation, 2024


Choose License Type


Features | Type of License | ||||
Data Book | Single User |   Multi User | Corporate | ||
| e-Access | ✓ | ✓ | ✓ | ✓ | |
User Sharing | 1 User Only | 1 User Only | Up to 7 Users | Unlimited User Access | |
⨉ | ⨉ | ⨉ | ✓ | ||
Free Customization | No Free Customization | Up To 30 hrs work | Up To 60 hrs work | Up To 80 hrs work | |
Deliverable |
| ⨉ | ✓ | ✓ | ✓ |
| ✓ | ⨉ | ✓ | ✓ | |
| ⨉ | ⨉ | ⨉ | ✓ | |
Analyst Support | 2-Months Analyst Support | 4-Months Analyst Support | 7-Months Analyst Support | One Year Analyst Support | |
Free Report update in next update cycle | ⨉ | ⨉ | ⨉ | ✓ | |
Free Industry Update (Within 180 days) | ⨉ | ⨉ | ⨉ | ✓ | |
Benefit | Up to 10% off on Post Purchase | Up to 20% off on Post Purchase | Up to 30% off on Post Purchase | Up to 40% off on Post Purchase | |