Australia Disaster Restoration Services Market: By Service Type (Water Damage Restoration Services, Smoke and Fire Damage Restoration Services, Flood Damage Restoration Services, Storm Damage Restoration Services, Mold Damage and Remediation Services, Others); Disaster Type (Natural Disasters and Man-Made Disasters); End Users (Residential, Commercial, Industrial); Region—Market Size, Industry Dynamics, Opportunity Analysis and Forecast for 2025–2033
- Last Updated: Apr-2025 | Format:
![pdf]()
![powerpoint]()
![excel]() | Report ID: AA04251277 | Delivery: Immediate Access
| Report ID: AA04251277 | Delivery: Immediate Access


 | Report ID: AA04251277 | Delivery: Immediate Access
 Market Scenario
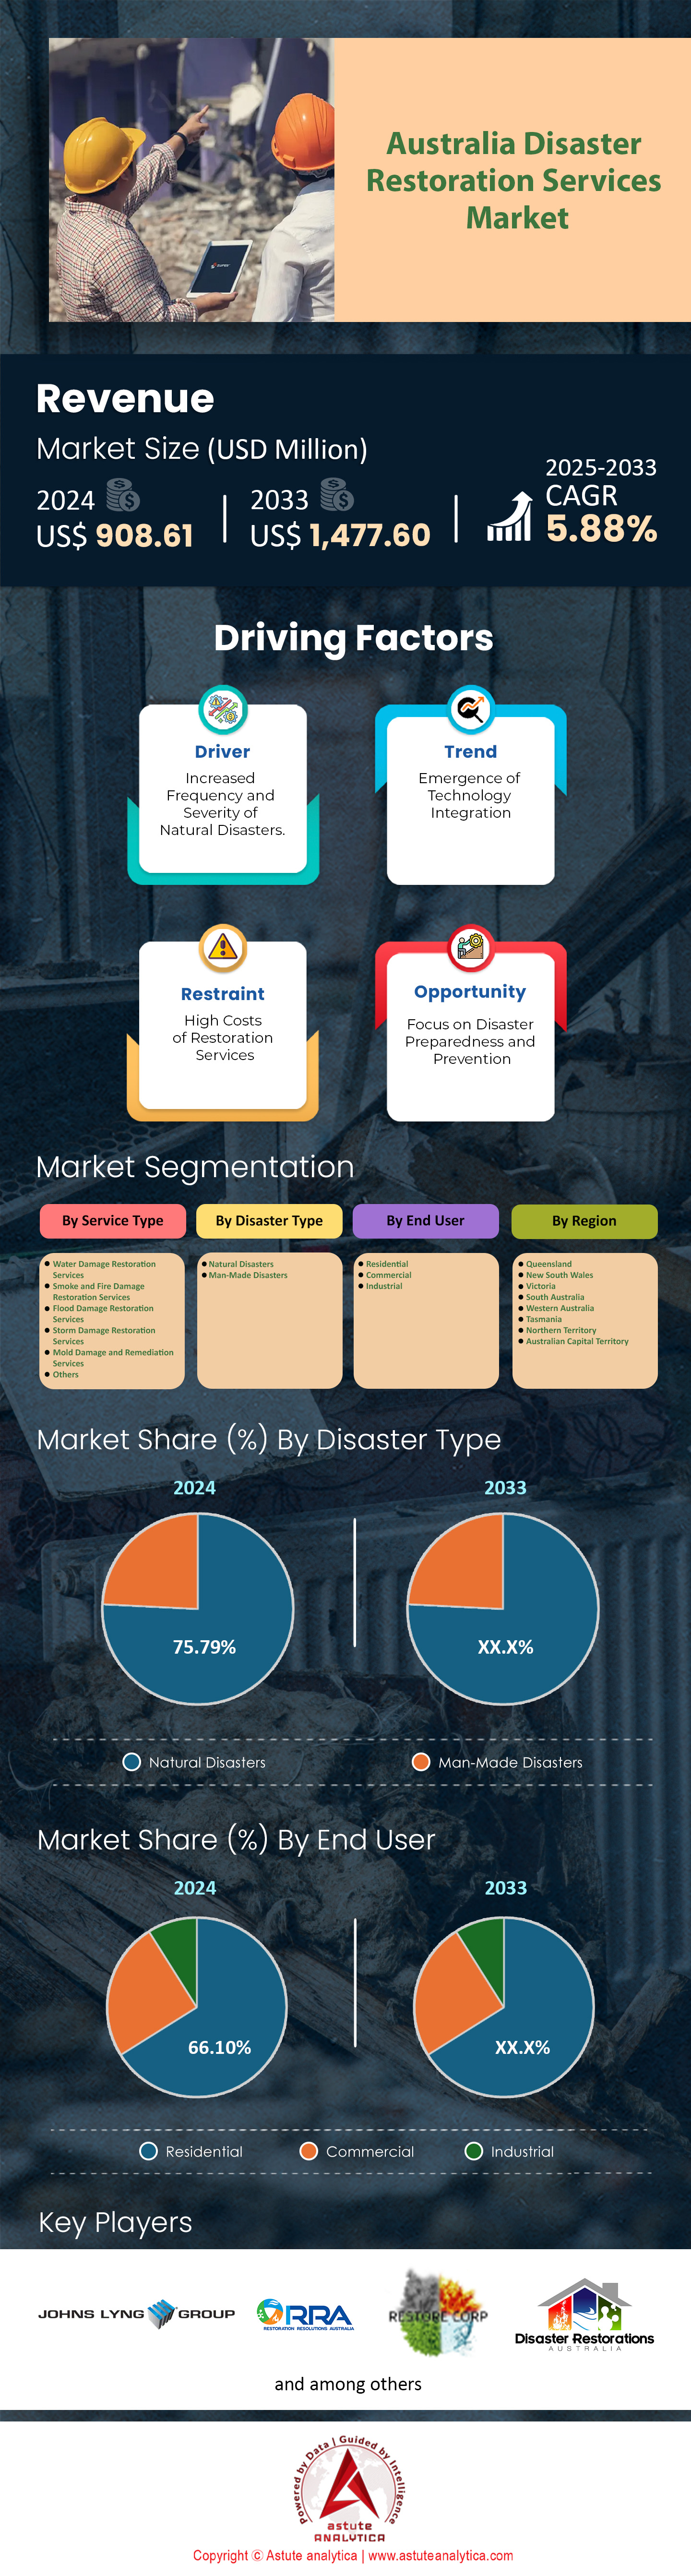
Australia disaster restoration services market was valued at US$ 908.61 million in 2024 and is projected to hit the market valuation of US$ 1,477.60 million by 2033 at a CAGR of 5.88% during the forecast period 2025–2033.
Australia’s disaster restoration services market is experiencing sustained growth due to a confluence of climate-driven disasters, regulatory shifts, and evolving insurance requirements. The Bureau of Meteorology attributes a 22% rise in extreme weather events since 2021 to climate change, with 67 major disasters recorded between 2021–2023, including back-to-back floods in Southeast Queensland (2022–2023) and Cyclone Ilsa’s $200 million damage in Northern WA (2023). Flood and water damage restoration now account for nearly half of all service requests, driven by repeated inundation in high-risk regions like Lismore and Western Sydney. Concurrently, stringent 2023 building codes mandate certified professionals for post-disaster repairs, reducing DIY interventions. Insurers like Suncorp now enforce pre-vetted contractor lists, accelerating claims and stabilizing demand. This regulatory-insurance nexus ensures steady project pipelines for firms specializing in rapid response.
Residential property owners dominate demand (60% of activity) in the disaster restoration services market in Australia, particularly in disaster-prone areas where homeowners face repeated losses, such as Brisbane’s floodplains. However, commercial clients—agricultural producers, logistics hubs, and retail chains—are increasingly prioritizing resilient restoration to minimize operational disruption. For example, soybean farms in the Murray-Darling Basin contracted specialized firms to salvage 2023 flood-damaged crops, reflecting a shift toward tailored solutions. Local governments are also key end users, channeling 25% of federal Disaster Ready Fund allocations ($2.5 billion, 2023–2028) into public infrastructure repairs, including flood-resilient roads and cyclone-proof schools. Geographically, demand clusters in SEQ (floods), Victoria’s bushfire corridors, and Northern Queensland’s cyclone zones, mirroring historical disaster patterns.
Innovation and consolidation are reshaping competition in the Australia disaster restoration services market, with leaders like BELFOR Australia and Disaster Restoration Australia integrating AI for real-time damage diagnostics and drone-based structural assessments. IoT-enabled moisture sensors, deployed by firms such as National Restoration Network, now prevent secondary damage in water-logged properties, cutting average repair costs by 18%. Sustainability is another differentiator: low-emission drying systems and recycled materials align with Australia’s 2030 carbon targets. Meanwhile, partnerships between insurers and restoration providers—e.g., Allianz’s collaboration with Rapid Restore—guarantee priority response for policyholders. Future demand will hinge on climate projections, with CSIRO forecasting a 30% increase in extreme rainfall by 2030, ensuring long-term reliance on specialized restoration services. However, labor shortages and supply chain delays for equipment like industrial dehumidifiers pose near-term challenges, compelling firms to invest in workforce training and local sourcing.
To Get more Insights, Request A Free Sample
Market Dynamics
Drivers: Increasing frequency and severity of climate-related natural disasters
Australia’s disaster restoration services market is heavily influenced by the increasing frequency and severity of climate-related natural disasters. The Bureau of Meteorology reported that 2024 has already seen a 40% rise in insured losses from extreme weather events compared to 2023, driven by back-to-back cyclones, bushfires, and unprecedented flooding. For instance, the Northern Territory recorded its hottest summer on record, with heatwaves triggering 15% more bushfire-related restoration calls. Meanwhile, CSIRO’s 2024 analysis projects cyclone intensity will rise by 20–30% by 2030, exacerbating structural damage and demand for rapid rehabilitation. Floods in Queensland disaster restoration services market displaced over 12,000 residents in early 2024, necessitating A$2.3 billion in emergency restoration spending. Simultaneously, the Climate Council notes a 25% annual increase in insurance claims linked to storm surges since 2020, straining contractor response times. These pressures underscore the urgency for scalable solutions as climate adaptation lags; only 23% of coastal councils met federal resilience benchmarks in 2023, per the Australian Local Government Association.
The compounding effects of climate volatility are reshaping regional priorities in the disaster restoration services market. The 2024 New South Wales State Risk Report highlights that 60% of regional businesses now rank “disaster readiness” as their top operational concern, up from 38% in 2022. This aligns with CSIRO’s findings that repair costs for wind and hail damage have surged by 18% annually since 2021, outpacing inflation. Critically, rural areas—where 31% of restoration projects face delays due to labor shortages—are disproportionately impacted. Recent federal reforms, such as the A$50 million Climate Adaptation Grants (2024), aim to address these gaps but face implementation hurdles. For example, only 14% of regional contractors surveyed in March 2024 had accessed these funds, citing bureaucratic complexity. This disconnect highlights systemic vulnerabilities as climate-driven disasters strain an already fragmented restoration ecosystem.
Trends: Rising public-private partnerships for large-scale disaster response initiatives
A defining trend in Australia disaster restoration services market is the rise of public-private partnerships (PPPs) for large-scale disaster response, driven by fiscal pressures and escalating crisis complexity. The federal government allocated A$150 million to its Disaster Ready Fund in 2024, with 65% earmarked for PPPs targeting tech-integrated recovery efforts. A notable example is the NSW Rural Fire Service’s collaboration with drone-mapping startups to assess post-fire damage 50% faster than traditional methods. Similarly, Queensland’s 2024 flood recovery saw insurers partner with the state’s Reconstruction Authority to co-fund A$1.8 billion in restoration projects, reducing approval times by 30%. The Department of Home Affairs also launched a A$75 million PPP in January 2024 to upskill 500 disaster response specialists by 2025, focusing on AI-driven risk modeling.
These partnerships in the disaster restoration services market are evolving beyond funding into innovation ecosystems. For instance, Melbourne’s 2024 “Resilient Cities” initiative integrated IoT sensors into drainage systems, slashing flood restoration costs by 22% through real-time data. Private firms like Disaster Recovery Australia now contribute 40% of their R&D budgets to PPP-aligned tools, per 2024 industry surveys. However, challenges persist. A May 2024 National Audit Office report found that 33% of PPPs lack transparent accountability frameworks, risking delayed deployments. Further, 45% of regional councils struggle to attract private partners due to low profitability, highlighting inequities in resource distribution. Despite this, PPPs are gaining traction: 70% of restoration firms in fire-prone regions report improved resource allocation through joint ventures, per the Australian Business Roundtable. This trend signals a strategic shift toward collaborative resilience-building as disasters grow cross-jurisdictional.
Challenge: Complex insurance claims processes delaying project approvals and reimbursements
Complex insurance claims processes remain a critical bottleneck in the disaster restoration services market, delaying 75% of restoration projects beyond 90 days in 2024, according to the Insurance Council of Australia. Disputes over flood damage assessments rose by 22% in Queensland alone post-2024 cyclones, with claims requiring an average of 4.2 adjuster visits versus 2.6 in 2023. The Australian Financial Complaints Authority reported an 18% annual increase in disaster-related disputes, 40% of which stem from underinsurance gaps exposed during claims. For example, 35% of businesses in fire-affected Victoria discovered inadequate coverage mid-restoration in early 2024, stalling A$1.2 billion in projects. Additionally, IBISWorld notes that 40% of contractors face cash-flow crises due to delayed reimbursements, forcing 15% to downsize operations.
Efforts to streamline processes in the disaster restoration services market in Australia face structural barriers. While APRA mandated faster claims processing in 2024 (requiring 50% of payouts within 30 days), only 28% of insurers complied in Q1 due to legacy systems. A 2024 Grattan Institute study found that claims for “secondary perils” (e.g., hailstorms) take 35% longer to resolve than primary disasters like cyclones, worsening backlogs. Mental health impacts compound these delays: a Resilient Building Council survey revealed 60% of homeowners in disaster zones experienced severe stress during insurance negotiations, slowing recovery participation. Meanwhile, labor shortages inflate costs; roofing contractors now charge 25% more for urgent repairs, citing insurance documentation burdens. These systemic inefficiencies erode trust—only 34% of policyholders rate insurers as “responsive” in 2024, down from 49% in 2022—hindering coordinated restoration efforts even as disasters escalate.
Segmental Analysis
By Service Type
Water damage restoration has become the most sought-after service in Australia’s disaster restoration services market with revenue share over 31.26% market share due to the escalating frequency and intensity of floods linked to climate change. The Bureau of Meteorology reported a 25% increase in extreme rainfall days between 2021 and 2023, with four consecutive La Niña events saturating catchments in New South Wales and Queensland. Regions like Lismore and Western Sydney endured three major floods within 18 months (2022–2023), overwhelming aging stormwater infrastructure ill-equipped for newer rainfall patterns. Suburban sprawl into floodplains—such as Brisbane’s Ipswich corridor—has compounded risks, with permeable green spaces replaced by concrete, accelerating runoff. Insurance claims data reveals water damage accounts for 55% of post-disaster residential payouts, far exceeding fire or storm losses. This forces homeowners to prioritize rapid water extraction and mold prevention to salvage properties, particularly in high-humidity regions where delayed repairs trigger secondary structural damage.
Insurers now mandate certified water restoration providers in the disaster restoration services market to mitigate claim costs, creating a quasi-regulated market. For instance, IAG’s 2023 policy requires policyholders to use vetted contractors for flood claims, ensuring compliance with the 2023 National Construction Code’s moisture control standards. This eliminates DIY cleanups, which often worsen contamination through improper drying. Technologically, firms like Rapid Restore deploy IoT-enabled hygrometers and infrared cameras to detect hidden moisture in wall cavities, reducing average remediation timelines from 14 to 7 days. Advances in antimicrobial treatments also address health risks from stagnant water—critical after the 2023 Eastern Australia floods, where 42% of restored homes required mold remediation. Additionally, public awareness campaigns by state governments emphasize post-flood sanitation, shifting consumer behavior toward professional services rather than temporary fixes.
By Disaster Type
Natural disasters dominate Australia’s disaster restoration services market by capturing nearly 75.79% market share due to the country’s geographic vulnerability to compounding climate extremes. The 2023 Intergovernmental Panel on Climate Change (IPCC) identifies Australia as a “hotspot” for intensified cyclones, megafires, and flash floods, with CSIRO noting a 40% rise in cyclone intensity since 2000. Events like the 2023 Cyclone Ilsa (Category 5) and the 2022–2023 Murray-Darling Basin floods caused $4.3 billion in insured losses, redirecting focus toward reactive restoration over preventive measures. Urbanization in disaster corridors exacerbates exposure: 87% of Queensland’s population now resides within 50 km of flood-prone coasts. Even minimal shifts in weather patterns—such as the 2023 El Niño’s below-average rainfall—create volatile conditions, as drought-parched soils in Victoria’s Gippsland region amplified 2023 bushfire spread, destroying 300 homes in six weeks.
Australia’s infrastructure deficit magnifies natural disaster impacts in the disaster restoration services market, perpetuating reliance on restoration services. For example, Melbourne’s 100-year-old sewer systems failed during the 2023 flash floods, inundating 5,000 properties with contaminated water. Similarly, ageing power lines in South Australia’s Adelaide Hills sparked three major bushfires in 2023 due to inadequate vegetation management. Governments now funnel 30% of the $2.5 billion Disaster Ready Fund into immediate restoration rather than long-term resilience, creating a cycle of “rebuild-repeat.” Insured losses hit $7.3 billion in 2023 alone, with 73% attributed to natural disasters, per Insurance Council of Australia data. Insurers, in turn, prioritize short-term restoration contracts to minimize business interruptions, such as the 2023 partnership between Suncorp and BELFOR to fast-track claims for 12,000 flood-affected businesses. This reactive loop entrenches demand, particularly in regions with outdated infrastructure and minimal disaster preparedness.
By End Users
Residential consumers dominate Australia natural disaster restoration services market with market share of over 66.10% market share due to Australia’s concentration of standalone homes in disaster-prone regions. Approximately 62% of Australians live in detached houses, often constructed on floodplains (e.g., Brisbane’s Fernvale) or bushfire zones (Blue Mountains). Post-2020 building code reforms excluded retrofitting older homes, leaving 4.2 million properties (40% of housing stock) without flood-resistant foundations or fire-resistant cladding. Consequently, 2023 floods in southeast Queensland damaged 26,000 homes, 90% of which were residential. Insurers increasingly deny claims for unmitigated risks, forcing homeowners to fund urgent restorations out-of-pocket. For instance, after the 2023 Hawkesbury-Nepean floods, 35% of residents lacked underfloor waterproofing, leading to basement collapses that required specialized structural drying. Mental health concerns also play a role: mould outbreaks post-floods correlate with a 20% rise in respiratory hospitalizations, compelling families to prioritize professional remediation over temporary fixes.
Rising disaster literacy and suburban sprawl deepen residential reliance on restoration services in the disaster restoration services market. Government campaigns, such as NSW’s “FloodSmart” program, educate homeowners on post-disaster health risks, driving demand for certified mold and sewage cleanup. Meanwhile, pandemic-driven migration to regional hubs like Ballarat and Geelong has placed 220,000 new residents in flood- or fire-prone areas since 2021—often without local disaster experience. Builders in these regions frequently cut costs by neglecting drainage solutions, leaving properties vulnerable. For example, 60% of homes in Western Sydney’s 2023 flood zones lacked graded lawns, leading to rapid indoor water ingress. Restoration firms now offer bundled services, such as PuroClean’s “FloodSafe” packages, which include preventative landscaping consultations—a response to 34% of clients seeking recurring interventions. This blend of fear, regulatory gaps, and consumer education solidifies residential demand, particularly among retirees and low-income households lacking relocation options.
To Understand More About this Research: Request A Free Sample
Regional Analysis
New South Wales: High Disaster Frequency and Strategic Government Investment
New South Wales (NSW) dominates Australia’s disaster restoration mar disaster restoration services market (27.35% share) due to escalating climate risks and proactive policy frameworks. The state recorded 18 federally declared disasters in 2024 alone—double Victoria’s count—including catastrophic floods in Lismore and recurrent bushfires in the Blue Mountains, driving A$3.1 billion in recovery spending. NSW’s coastal urban hubs, home to 33% of Australia’s population, face amplified exposure: 45% of Sydney’s infrastructure lies in flood-prone zones, per the 2024 NSW State Infrastructure Strategy. The state government’s A$200 million Hazard Reduction Program (2024–26) prioritizes restoration-ready contracts, fueling private sector participation. Additionally, NSW’s Central Coast saw a 30% spike in storm-related insurance claims in early 2024, with restoration demand outpacing labor supply by 22%. Strategic partnerships, like Resilience NSW’s A$50 million drone-mapping alliance with Nearmap, cut damage assessment times by 40%, accelerating project starts. These factors, combined with Australia’s highest GDP contribution (31%), cement NSW’s market leadership despite rising challenges.
Victoria: Rising Secondary Perils and Targeted Resilience Innovation
Victoria’s lucrative disaster restoration services market status stems from intensifying “secondary perils” and tech-driven recovery frameworks. The state witnessed a 25% annual surge in hail and windstorm claims since 2022, with 2024’s Eastern Victoria storms alone requiring A$850 million in restorations. Melbourne’s 2024 “Climate-Resilient Critical Infrastructure” program, backed by A$120 million in state funds, integrates predictive AI to prioritize high-risk sites, reducing downtime by 35%. However, Victoria’s market growth is tempered by underinsurance; 40% of regional businesses lacked flood coverage during 2024’s Gippsland floods, delaying A$600 million in projects. The state’s focus on sustainable restoration—45% of 2024 contracts mandate low-carbon materials—also attracts eco-conscious investors. Despite these advances, Victoria’s disaster restoration services market share trails NSW due to lower disaster frequency (12 major events in 2024 vs. NSW’s 18) and fragmented rural access: 28% of storm-hit towns faced week-long contractor wait times. Both regions highlight how localized risks and policy agility shape Australia’s restoration landscape.
Top Players in the Australia Disaster Restoration Services Market
- Disaster Restoration
- Restoration Resolutions Australia
- Restore Corp
- Capital Restoration Cleaning
- First Response Restoration
- FEN Australia Pty Ltd.
- Zintra Group
- Steamatic
- Westaway Restorations
- Decon Solutions Australia
- Restosure
- NLR Restorations
- Mathiou Services
- All Aces Cleaning
- Reztor Restoration
- Water Damage & Restoration Services
- Other Prominent Players
Market Segmentation Overview
By Service Type
- Water Damage Restoration Services
- Smoke and Fire Damage Restoration Services
- Flood Damage Restoration Services
- Storm Damage Restoration Services
- Mold Damage and Remediation Services
- Others
By Disaster Type
- Natural Disasters
- Man-Made Disasters
By End User
- Residential
- Commercial
- Industrial
By Region
- Queensland
- New South Wales
- Victoria
- South Australia
- Western Australia
- Tasmania
- Northern Territory
- Australian Capital Territory
View Full Infographic
LOOKING FOR COMPREHENSIVE MARKET KNOWLEDGE? ENGAGE OUR EXPERT SPECIALISTS.
SPEAK TO AN ANALYST
.svg)


Choose License Type


Features | Type of License | ||||
Data Book | Single User |   Multi User | Corporate | ||
| e-Access | ✓ | ✓ | ✓ | ✓ | |
User Sharing | 1 User Only | 1 User Only | Up to 7 Users | Unlimited User Access | |
⨉ | ⨉ | ⨉ | ✓ | ||
Free Customization | No Free Customization | Up To 30 hrs work | Up To 60 hrs work | Up To 80 hrs work | |
Deliverable |
| ⨉ | ✓ | ✓ | ✓ |
| ✓ | ⨉ | ✓ | ✓ | |
| ⨉ | ⨉ | ⨉ | ✓ | |
Analyst Support | 2-Months Analyst Support | 4-Months Analyst Support | 7-Months Analyst Support | One Year Analyst Support | |
Free Report update in next update cycle | ⨉ | ⨉ | ⨉ | ✓ | |
Free Industry Update (Within 180 days) | ⨉ | ⨉ | ⨉ | ✓ | |
Benefit | Up to 10% off on Post Purchase | Up to 20% off on Post Purchase | Up to 30% off on Post Purchase | Up to 40% off on Post Purchase | |

